Introduction
In recent years, the landscape of global central counterparty margin models has witnessed a significant transformation in risk management. Central to this shift is the migration from the long-established Standard Portfolio Analysis of Risk (SPAN) model to various Value-at-Risk (VaR) based models for the purpose of calculating margin for exchange-traded derivatives.
This transition began in 2022 but accelerated substantially in 2023 and will continue through 2024 and beyond. The adoption of these new margin models will benefit market participants through the more efficient use of capital, but the new models are more complex and less transparent. As clearinghouses expand the use of these models across the global ETD markets, clearing members and their clients will need to consider the impacts on margin requirements, collateral management, and trading strategies.
The SPAN Era and Its Gradual Transition
For decades, SPAN has been the cornerstone of margin modelling in the ETD space. Developed in 1988 by the Chicago Mercantile Exchange, it gained prominence for its straightforward approach to assessing portfolio risk. It emerged as the most widely used methodology by CCPs worldwide, helped by its inherent conservatism. However, the growing complexity of financial products and the need for more dynamic risk assessment have gradually exposed SPAN’s limitations, particularly in handling large, diverse portfolios and unforeseen market events.
Rise of VaR-Based Models
The transition to VaR models marks a new chapter in CCP risk management. Portfolio VaR models, introduced by financial institutions for their trading portfolios in the 1990s, offer a more nuanced risk assessment by considering a broader range of market scenarios and portfolio compositions. VaR models offer integrated evaluations of portfolio risks, considering the effects of hedging, diversification, and cross-correlations. Interestingly, the first application of VaR models by CCPs was in the clearing of interest rate swaps, reflecting a standard practice among dealers in the over-the-counter market.
VaR models represent a significant departure from the methodology employed by SPAN. Unlike SPAN, which tends to assess product-level risk exposures first to compute portfolio margin, VaR models calculate margin by analysing the risk exposures for a portfolio of positions as a whole. This holistic approach provides a more integrated and comprehensive view of potential risks. Additionally, VaR models employ a larger number of scenarios for calculating potential profits and losses, allowing for a more comprehensive and varied assessment of market conditions and their impact. Furthermore, VaR models offer a more accurate approach to measuring non-linear risks, which are prevalent in complex portfolios. This enhanced capability to handle non-linear risk exposures gives VaR models a distinct advantage, especially in markets characterised by rapid changes and volatility.
VaR models come in different forms, each with its unique approach to risk assessment. The Historical Simulation VaR (HS VaR) includes two primary types: the simple historical simulation, which relies on direct historical data, and the Filtered Historical Simulation, which adjusts historical data for current market conditions, enhancing its relevance. On the other hand, the Monte Carlo Simulation VaR (MC VaR) uses stochastic modelling to simulate a wide range of potential future market scenarios, providing a probabilistic range of potential gains and losses.
Furthermore, it's important to distinguish between the VaR risk measure and the Expected Shortfall (ES) risk measure, also known as conditional VaR. While VaR indicates the maximum expected loss over a given period at a specific confidence level, ES goes a step further. It provides an average of the losses that exceed the VaR threshold, essentially capturing the tail risk or extreme losses that lie beyond the VaR limit. This distinction is crucial as ES offers a more comprehensive view of potential extreme losses, making it a valuable tool for risk assessment. Both HS VaR and MC VaR approaches can be adapted to use the ES measure, allowing for a more in-depth analysis of risk exposures in extreme market conditions.
Current Global Landscape
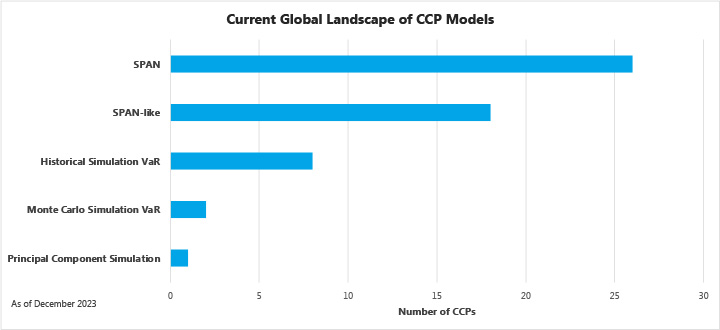
The chart illustrates the current margin model landscape among ETD CCPs worldwide, with SPAN and SPAN-like models still reigning as the predominant frameworks in use by 26 and 18 CCPs, respectively. This prevalence underscores the entrenched position of SPAN models in risk management. However, a shift is on the horizon: eight CCPs have already embraced HS VaR models, and another two have implemented MC VaR models, signalling a gradual but definitive transition towards VaR-based systems, including ES measure variations. These advanced VaR models are anticipated to eventually supersede the traditional SPAN, marking a new era in risk management that aligns with the complexities of today's financial markets.
In addition, one CCP, Nasdaq Clearing in Stockholm, uses a Principal Component Analysis (PCA) approach, which is a distinct framework compared to SPAN and VaR, to simulate curve scenarios for the fixed income derivatives that it clears.
Amidst this transformative shift, it is worth acknowledging the early innovators who paved the way for the adoption of VaR-based models. Notably, the Options Clearing Corporation introduced its STANS model in 2006, which utilised Monte Carlo simulation-based Expected Shortfall – a first in the US. In 2009, LCH Clearnet implemented a HS VaR margin model for the electricity futures traded on Nodal Exchange. Nodal Exchange subsequently established its own clearinghouse, Nodal Clear, and implemented an ES VaR model. In 2013 Eurex which began implementing its PRISMA model, which is based on FHS VaR, making it the first CCP to apply a VaR model to financial futures.
Major CCPs Leading the Change
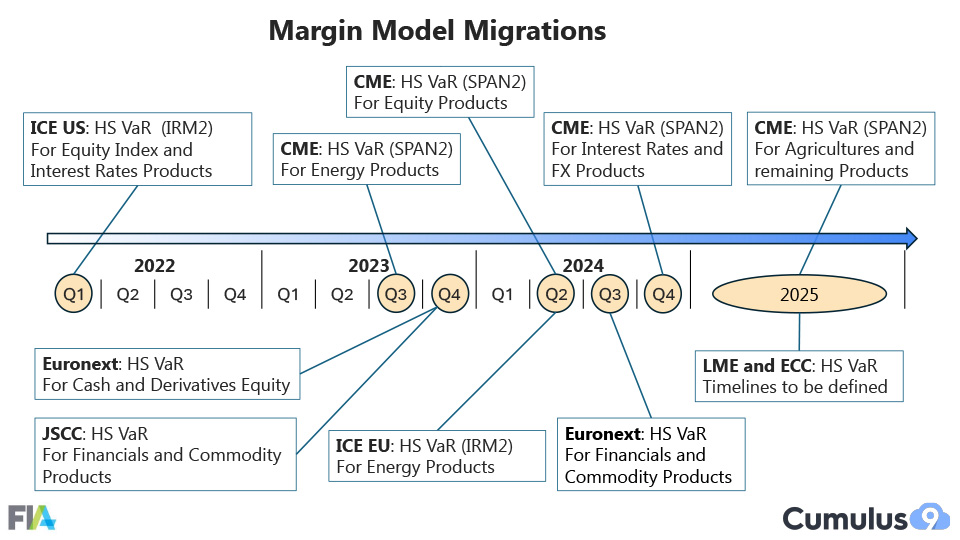
Currently we are seeing an acceleration of this transition, with several key CCPs leading the way. The timeline diagram mapping out the recent and forthcoming transitions in CCP margin models from 2022 to 2025 paints a clear picture of the industry's direction.
In the first quarter of 2022, the ICE Clear US (ICE US) set the stage with the implementation of its IRM2 model for equity index and interest rates products. This initiation was followed by a notable shift in the third quarter of 2023, as CME deployed SPAN2 for its heavily traded set of energy products, signalling a broader movement toward updated risk management practices.
More recently, Euronext and the Japan Securities Clearing Corporation both adopted VaR models for various products. The momentum continues through 2024, with key players like CME, ICE Clear Europe and Euronext expanding their implementations across a wider range of products, including energy, equity, and financial derivatives. CME is expected to complete the adoption of SPAN2 for its agriculture and remaining commodity products by the end of 2025.
This progressive timeline demonstrates a clear and concerted move by major CCPs towards more sophisticated margin models. While SPAN models may continue to be relevant for simpler products at smaller CCPs, VaR models are becoming the standard for larger CCPs handling complex portfolios.
Challenges and Considerations
Despite the advantages, the transition to VaR models is not without challenges. It demands robust governance, careful calibration, and the management of procyclical tendencies.
There are noteworthy practical distinctions between VaR and SPAN models. Firstly, VaR models are more computationally intensive compared to SPAN. The breadth of scenarios demands significant computational power. This complexity represents a substantial technological shift from the relatively simpler calculations required by SPAN models.

Furthermore, the intricate algorithms and internal workings of VaR models can be less transparent, leading to difficulties in predicting how changes in market conditions or portfolio compositions will affect margin calls. For example, it is easier for a trading desk to attribute a portfolio's SPAN margin to specific trading strategies, compared to doing it for a VaR model, which aggregates position P&Ls across all strategies. This highlights the need for additional transparency into how margin is calculated and a comprehensive set of tools that allow market participants to better anticipate the potential changes in margin requirements during periods of stress.
Additionally, there are other operational differences to consider. For example, the frequency and process of updating risk parameters in VaR models varies significantly compared to SPAN, affecting the day-to-day management of margin requirements. The transition to VaR models also requires retraining the risk management teams as well as changes in internal systems and processes to accommodate the new methodologies.
These practical and operational differences underscore the need for careful consideration and adaptation as CCPs and market participants navigate the shift from SPAN to VaR models.
Conclusion
The move from SPAN to VaR models signifies a crucial evolution in the CCP landscape, driven by the need for more dynamic and comprehensive risk assessment tools. As the industry navigates this transformation, it faces the dual challenge of embracing innovation while ensuring financial stability and systemic resilience.