For the fourth year in a row, global trading volume on derivatives exchanges set a record. The total number of futures and options traded in 2021 reached 62.58 billion contracts, up a whopping 33.7% from the previous year.
The growth in trading activity was concentrated in certain parts of the world, however. Much of the increase took place on exchanges in three countries: Brazil, China and India. Although the derivatives markets in these countries are very different, they all had one thing in common – strong demand from domestic market participants.
In China, for example, the main driver was rapid growth in commodity futures. In India, it was speculative trading of equity index options. And in Brazil, it was higher volume in both interest rate and equity index contracts.
Meanwhile, the derivatives industry's core markets in North America and Europe had relatively muted gains. Certain exchanges benefited from a surge of interest from retail investors, but trading was down in many of the flagship equity index and interest rate contracts used by institutional investors and corporate hedgers.
This contrast in growth trends has at least two implications for global brokers and trading firms. First, the rapidly growing markets in Brazil, China and India provide new opportunities for these firms to expand their businesses – but only if they can navigate the operational and regulatory complexities of doing business in these countries. The authorities in these countries are interested in encouraging more foreign participation, but there are many unique features of these markets that create barriers to entry.
Second, for those firms active in commodities trading, the rise of China's markets has changed the way these firms estimate supply and demand at the global level. China's futures exchanges have become important centers for price discovery in metals such as copper, aluminum and steel and in agricultural products such as cotton and sugar. Keeping an eye on price developments in Shanghai, Dalian and Zhengzhou is now standard business practice for commodity traders in other parts of the world.
Another major trend in 2021 was the rise of retail participation, especially in the trading of equity index and single stock options. These contracts offer a relatively simple way to speculate on price movements in equity markets. The increase in volatility since the onset of the pandemic, combined with the ease of access provided by online brokers, has sparked unprecedented enthusiasm for these contracts among individual traders. One effect of this trend was that in 2021, for the first time ever, there were more options traded on exchanges than futures.
Despite this surge in trading activity, the total number of outstanding contracts was almost unchanged. At the end of 2021, open interest across the industry stood at 1.076 billion contracts, up 2.6% from 1.048 billion contracts at year-end 2020.
FIA collects volume and open interest data from more than 80 exchanges around the world. The statistics on volume include all futures and options that are traded on or cleared through these exchanges. FIA measures volume and open interest in terms of the number of contracts that are transacted, rather than the value of the contracts. More statistics and tables are available in FIA's year-end ETD volume report. Those who are interested can download a full spreadsheet of FIA data.
Equities lead the way
The vast majority of 2021's growth in trading activity was in the equity category, which consists of futures and options based on equity indices, individual stocks and exchange-traded funds. This category was both the largest in terms of volume and the fastest growing. The total volume of equity contracts rose 46.7% to 41.64 billion in 2021, which was equivalent to roughly two-thirds of all global trading in futures and options.
2021 volume and open interest by category
| Category | Jan-Dec 2021 Volume |
Jan-Dec 2020 Volume |
Volume % Change |
2021 December Open Interest |
2020 December Open Interest |
Open Interest % Change |
| Equity | 41,643,207,304 | 28,379,423,779 | 46.70% | 749,095,409 | 726,627,637 | 3.10% |
| Currencies | 5,542,070,172 | 4,512,602,976 | 22.80% | 35,616,555 | 32,726,530 | 8.80% |
| Interest Rates | 4,577,345,777 | 4,115,441,972 | 11.20% | 172,810,694 | 173,541,011 | -0.40% |
| Agriculture | 2,820,109,552 | 2,570,657,307 | 9.70% | 23,622,214 | 22,988,649 | 2.80% |
| Metals | 2,765,534,503 | 2,398,531,605 | 15.30% | 15,227,172 | 14,268,665 | 6.70% |
| Energy | 2,710,751,767 | 3,151,107,672 | -14.00% | 61,400,612 | 61,463,956 | -0.10% |
| Other | 2,525,665,045 | 1,687,584,826 | 49.70% | 17,984,453 | 16,410,463 | 9.60% |
| Total | 62,584,684,120 | 46,815,350,137 | 33.70% | 1,075,757,109 | 1,048,026,911 | 2.60% |
Based on the number of contracts traded and/or cleared at 86 exchanges worldwide. Data © Futures Industry Association.
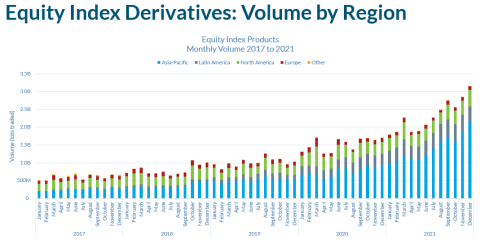
Within this category, one of the major trends has been the rapid growth in the trading of equity index futures and options over the last five years. As the chart below shows, more than 3 billion equity index futures and options were traded in the month of December. That was roughly six times the amount traded five years ago. And the majority of those contracts are traded on exchanges in the Asia-Pacific region.
Drilling down to the level of individual contracts, the importance of the Indian market becomes obvious. The top two contracts on the list of the top 20 equity index contracts in 2021 were both index options listed on the National Stock Exchange of India, and their trading volume in 2021 was roughly double the previous year. These contracts are supported by a large ecosystem of brokers and information providers that facilitate retail trading on a massive scale as well as a small number of foreign brokers and market making firms.
Another important market is Brazil's B3. Trading volume in its mini-sized futures on the Bovespa stock index jumped 58.3% last year to 4.62 billion contracts. That was more than 10 times the volume in the E-mini S&P 500 futures traded on CME, the second-most heavily traded equity index future in the world. Open interest rose even faster, up 69% to almost 690,000 contracts outstanding at year-end. However, the level of open interest was far below that of the E-mini S&P 500 futures, a sign that a higher percentage of the trading volume was short-term in nature.
The sharp increase in the trading of futures and options based on the Nasdaq 100 index, which is often used as a proxy for the technology sector of the US stock market, is also worth noting. The volume of trading in options on the QQQ exchange-traded fund, which tracks that index, jumped 39.2% to 349.1 million contracts. Additionally, the micro E-mini futures on the Nasdaq 100, which are one-tenth the size of regular E-mini contracts, jumped 33.9% to 239.1 million contracts. A major factor in the growth in trading was retail interest in technology companies in the Nasdaq 100 index such as Apple, Microsoft, Amazon, Facebook (now Meta), Tesla and Nvidia.
Top 20 equity index futures and options contracts, ranked by volume
| Rank | Contract | Jan-Dec 2021 Volume | Volume % Change | 2021 December Open Interest |
Open Interest % Change |
| 1 | Bank Nifty Index Options, National Stock Exchange of India | 8,536,738,069 | 98.80% | 1,451,958 | 8.40% |
| 2 | CNX Nifty Index Options, National Stock Exchange of India | 5,497,680,235 | 131.70% | 2,871,404 | 16.10% |
| 3 | Mini Ibovespa Index (WIN) Futures, B3 | 4,622,466,696 | 58.30% | 689,794 | 67.30% |
| 4 | SPDR S&P 500 ETF Options * | 1,146,563,856 | 1.60% | 16,578,125 | -11.00% |
| 5 | S&P Sensex Index (BSX) Options, BSE | 614,527,737 | 1686.70% | 470 | n/a |
| 6 | Kospi 200 Options, Korea Exchange | 535,325,603 | -12.30% | 2,047,408 | -2.30% |
| 7 | E-mini S&P 500 Futures, Chicago Mercantile Exchange | 403,640,014 | -19.60% | 2,300,981 | -9.30% |
| 8 | Powershares QQQ ETF Options * | 349,161,303 | 39.20% | 8,207,688 | -0.10% |
| 9 | S&P 500 Index (SPX) Options, Cboe Options Exchange | 344,700,599 | 10.10% | 14,638,009 | 16.60% |
| 10 | Micro E-mini Nasdaq 100 Index Futures, Chicago Mercantile Exchange | 239,115,577 | 33.90% | 57,375 | 13.00% |
| 11 | Euro Stoxx 50 Index Options, Eurex | 227,211,474 | -23.00% | 29,206,474 | -4.10% |
| 12 | Nikkei 225 Mini Futures, Osaka Exchange | 224,009,276 | -30.40% | 331,413 | -9.40% |
| 13 | Euro Stoxx 50 Index Futures, Eurex | 223,870,918 | -36.40% | 2,677,946 | -8.20% |
| 14 | Micro E-mini S&P 500 Index Futures, Chicago Mercantile Exchange | 218,602,634 | -3.60% | 95,952 | 50.80% |
| 15 | Taiex (TXO) Options, Taiwan Futures Exchange | 197,333,257 | -2.20% | 364,907 | -9.70% |
| 16 | Kospi 200 Weekly Options, Korea Exchange | 187,965,562 | 56.60% | 46,259 | 225.10% |
| 17 | iShares Russell 2000 ETF Options * | 173,036,065 | 18.10% | 6,704,009 | -5.80% |
| 18 | India 50 Index Options, India International Exchange | 166,689,177 | 145.10% | 565 | 743.30% |
| 19 | RTS Index Futures, Moscow Exchange | 151,785,767 | -2.70% | 548,572 | 39.80% |
| 20 | E-mini Nasdaq 100 Futures, Chicago Mercantile Exchange | 140,406,331 | -4.30% | 208,988 | -5.40% |
* Indicates traded on multiple U.S. options exchanges. Data © Futures Industry Association.
Trading volume only tells part of the story, however. Open interest, which measures the number of outstanding contracts, did not have the same rate of increase, and in many cases, actually declined over the course of 2021. This trend is best shown by re-ranking the top contracts by open interest as of the end of 2021. Out of the top 20 contracts by open interest, only six had an increase in open interest compared to the previous year. The other 14 were either down or roughly unchanged. This suggests that much of the increase in trading activity in the equity index sector was short-term in nature and did not carry over into an increase in the total size of market exposure held by market participants.
It is also worth noting that 16 out of the top 20 equity index contracts by open interest were listed on exchanges in Europe and the US. This includes eight ETF options that are listed on multiple US options exchanges and cleared at the OCC. These contracts tend to be favored by institutional investors as a way to hedge the risk or enhance the returns in their investment portfolios. In many cases, these investors hold their positions over a long period of time, with trading concentrated during the "roll" periods
One example is the banking sector index options listed on Eurex. The Euro Stoxx Banks index is comprised of European banks such as BNP Paribas, Banco Santander and ING. Trading volume in the options on this index was 56.3 million contracts in 2021, making it the 31st largest equity index derivative contract by volume. On the other hand, open interest at year-end was 9.05 million, the fourth-highest in the open interest ranking, which is a clear sign of strong involvement by institutional investors and risk managers.
Top 20 equity index futures and options contracts, ranked by open interest
| Rank | Contract | Jan-Dec 2021 Volume | Volume % Change | 2021 December Open Interest |
Open Interest % Change |
| 1 | Euro Stoxx 50 Index Options, Eurex | 227,211,474 | -23.00% | 29,206,474 | -4.10% |
| 2 | SPDR S&P 500 ETF Options * | 1,146,563,856 | 1.60% | 16,578,125 | -11.00% |
| 3 | S&P 500 Index (SPX) Options, Cboe Options Exchange | 344,700,599 | 10.10% | 14,638,009 | 16.60% |
| 4 | Euro Stoxx Banks Options, Eurex | 56,297,053 | -5.10% | 9,051,116 | -8.60% |
| 5 | Powershares QQQ ETF Options * | 349,161,303 | 39.20% | 8,207,688 | -0.10% |
| 6 | iShares Russell 2000 ETF Options * | 173,036,065 | 18.10% | 6,704,009 | -5.80% |
| 7 | iShares MSCI Emerging Markets ETF Options * | 58,892,445 | -18.20% | 6,190,468 | -15.00% |
| 8 | Financial Select Sector SPDR ETF Options * | 61,953,540 | 3.80% | 4,232,243 | -8.00% |
| 9 | CNX Nifty Index Options, National Stock Exchange of India | 5,497,680,235 | 131.70% | 2,871,404 | 16.10% |
| 10 | Euro Stoxx 50 Index Futures, Eurex | 223,870,918 | -36.40% | 2,677,946 | -8.20% |
| 11 | VanEck Vectors Gold Miners ETF Options * | 32,723,783 | -21.70% | 2,608,022 | -7.30% |
| 12 | SPDR Energy Select Sector ETF Options * | 48,701,833 | 90.50% | 2,435,578 | -9.10% |
| 13 | iShares MSCI Brazil ETF Options * | 44,922,825 | 27.40% | 2,401,981 | 1.50% |
| 14 | E-mini S&P 500 Futures, Chicago Mercantile Exchange | 403,640,014 | -19.60% | 2,300,981 | -9.30% |
| 15 | Kospi 200 Options, Korea Exchange | 535,325,603 | -12.30% | 2,047,408 | -2.30% |
| 16 | E-mini S&P 500 Options, Chicago Mercantile Exchange | 83,666,476 | -1.30% | 1,553,218 | 42.10% |
| 17 | Euro Stoxx Banks Futures, Eurex | 67,050,486 | -27.50% | 1,525,499 | -6.60% |
| 18 | iPath S&P 500 VIX Short Term ETN Options * | 67,627,915 | -7.80% | 1,469,974 | -19.60% |
| 19 | Bank Nifty Index Options, National Stock Exchange of India | 8,536,738,069 | 98.80% | 1,451,958 | 8.40% |
| 20 | Mini MSCI Emerging Markets Futures, ICE Futures U.S. | 37,935,284 | -17.60% | 1,086,156 | -10.90% |
* Indicates traded on multiple U.S. options exchanges. Data © Futures Industry Association.
ESG and emissions: Two emerging growth areas
Within the institutional side of the business, there were two areas of notable growth—one in the equity index sector and one in the commodity sector.
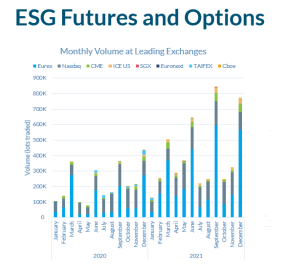
The first was in the trading of ESG futures. These contracts are based on equity indices that have been constructed in line with Environmental, Social and Governance criteria. Although ESG futures make up only a tiny slice of the overall equity index market, the trading of these contracts is growing very rapidly. Total ESG futures volume jumped 84% to 4.8 million contracts in 2021. Open interest rose even faster, up 133% to just under 340,000 contracts. These contracts tend to be used by fund managers as a substitute for conventional equity index futures. Eurex is the leader in this sector of the market, with the largest share of the volume and open interest and the largest number of contracts.
The second was in futures and options based on emission allowances and offsets. Although this type of contract has been around for many years, the amount of trading activity increased substantially in 2021 as more attention turned to the problem of climate change. Emission allowances are increasingly valuable to corporations that are subject to limitations on their emissions, and they are also becoming popular with investors that want to add this asset class to their portfolios. This sector of the commodity derivatives markets also saw the introduction of several new contracts in 2021, including UK emission allowance futures traded on ICE Futures Europe and voluntary carbon offset futures traded on CME.
Emissions trading on futures exchanges
| Exchange | Jan-Dec 2021 Volume | % Change | 2021 Dec Open Interest |
Open Interest % Change |
| ICE (EU) | 15,732,443 | 27% | 1,106,026 | -6% |
| ICE (US) | 3,476,686 | 21% | 395,322 | 20% |
| EEX | 723,026 | 24% | 294,908 | 19% |
| Nodal | 83,091 | 357% | 18,157 | 319% |
| CME | 47,149 | N/A | 9,432 | N/A |
| Nasdaq | 830 | -59% | 85 | -29% |
| Total | 20,063,225 | 26% | 1,823,930 | 4% |
Note: ICE (EU) combines data for ICE Futures Europe and ICE Endex. Data © Futures Industry Association.
Rates trading in recovery
In the first quarter of 2020, trading of interest rate futures and options hit a record 1.54 billion contracts as market participants reacted to the economic impact of the pandemic and adjusted to the drastic downshift shift in the outlook for interest rates. For the rest of the year, however, trading volume contracted as central banks flooded the markets with liquidity.
Towards the end of 2021 a change in the outlook for interest rates triggered a resurgence of trading. However, the overall level of trading activity remained below the peak set in the first quarter of 2020.
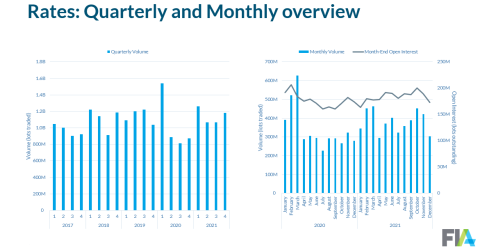
Open interest has followed a similar pattern, though the fluctuations have not been as severe. The overall level of open interest in interest rate futures and options bottomed out in the third quarter of 2020 and then rebounded in the next three quarters. In fact, interest rate open interest in these products hit an all-time record of 190.3 million contracts in June 2021. Open interest ended the year at 172.8 million contracts, down slightly from December 2020.
Drilling down to individual contracts, the most actively traded contract in the rates sector was the the one-day interbank deposit futures listed on Brazil's B3. This contract benefited from a very sharp increase in Brazil's short term interest rates towards the end of the year. On the other hand, options on these futures fell out of favor, with volume down 40% and open interest down 21%.
Meanwhile, in the US trading of Eurodollar futures rose by almost 20% compared to the previous year. One key factor in that increase was the shift in US Federal Reserve monetary policy towards raising interest rates and unwinding its purchases of bonds. This led to increased interest in the more distant contract months, especially those three or four years out. A similar trend boosted trading in mid-curve options on Eurodollar futures, which provide market participants with a way to take a view on where interest rates will be two or three years down the road. Volume in these options almost tripled compared to 2020, and open interest was up 70% to 10.9 million contracts.
Another important trend in 2021 was the transition out of Libor-based interest rate futures. In the UK, ICE Futures Europe successfully completed the transition out of the short sterling contract, with open interest ending the year at zero, and the futures on SONIA are now the primary short-term interest rate contract in the sterling market. In the US, the trading of SOFR futures picked up over the course of 2021, especially in the last few months of the year, but as of year-end the trading volume was still less than a quarter of the trading volume in Eurodollar futures.
Turning to the government bond contracts, volume in the 10-year US Treasury futures rose by nearly 16% over 2020 and open interest rose by almost 21%. The primary reason for this jump in trading activity was the market's response to the shift in Fed policy in the final months of the year. Expectations of higher interest rates, combined with concerns about inflation, sparked greater interest in using these contracts to hedge interest rate risk and adjust interest rate exposures in investment portfolios.
Top 20 interest rate futures and options contracts
| Rank | Contract | Jan-Dec 2021 Volume | Volume % Change | 2021 December Open Interest |
Open Interest % Change |
| 1 | One-Day Interbank Deposit (DI1) Futures, B3 | 654,265,238 | 26.90% | 28,014,813 | 2.40% |
| 2 | Eurodollar Futures, Chicago Mercantile Exchange | 610,431,078 | 19.70% | 11,253,242 | 23.00% |
| 3 | 10 Year Treasury Note Futures, Chicago Board of Trade | 469,746,624 | 15.70% | 3,893,704 | 20.60% |
| 4 | 5 Year Treasury Note Futures, Chicago Board of Trade | 281,860,840 | 15.10% | 3,762,255 | 14.30% |
| 5 | Eurodollar Mid-Curve Options, Chicago Mercantile Exchange | 202,913,484 | 145.30% | 10,900,377 | 69.60% |
| 6 | Euro-Bund Futures, Eurex | 202,679,077 | 16.20% | 1,243,915 | 11.50% |
| 7 | 3 Month Euribor Futures, ICE Futures Europe | 186,747,304 | 7.10% | 4,014,580 | 28.80% |
| 8 | 10 Year Treasury Note Options, Chicago Board of Trade | 159,684,869 | 25.60% | 2,103,306 | -2.50% |
| 9 | Average One-Day Interbank Deposit Rate Index (IDI) Options, B3 | 142,423,687 | -39.80% | 43,590,071 | -21.10% |
| 10 | 3 Month Sterling Futures, ICE Futures Europe 1 | 134,249,188 | -16.60% | 0 | -100.00% |
| 11 | Euro-Bobl Futures, Eurex | 124,722,358 | 17.00% | 1,364,835 | 42.20% |
| 12 | 2 Year Treasury Note Futures, Chicago Board of Trade | 115,497,784 | -10.40% | 1,960,430 | 2.00% |
| 13 | 30 Year Treasury Bond Futures, Chicago Board of Trade | 113,446,877 | 18.60% | 1,199,037 | 3.20% |
| 14 | Ultra 10 Year Treasury Note Futures, Chicago Board of Trade | 93,791,008 | 45.20% | 1,368,765 | 36.30% |
| 15 | Euro-Schatz Futures, Eurex | 85,564,863 | -9.60% | 1,254,972 | 2.30% |
| 16 | Long Gilt Futures, ICE Futures Europe | 73,796,205 | 20.80% | 781,592 | 67.20% |
| 17 | Eurodollar Options, Chicago Mercantile Exchange | 64,034,656 | -65.40% | 18,616,814 | 10.50% |
| 18 | Iboxx High Yield Corporate Bond ETF Options * | 62,365,461 | -5.80% | 5,531,607 | 19.10% |
| 19 | 10 Year Treasury Bond Futures, ASX 24 | 60,125,766 | -2.20% | 1,098,383 | -21.60% |
| 20 | Ultra Treasury Bond Futures, Chicago Board of Trade | 57,759,797 | 10.20% | 1,244,576 | 19.20% |
* Indicates traded on multiple U.S. options exchanges. Data © Futures Industry Association.
Trends in commodities
At the global level, the volume of commodity futures and options trading rose rapidly during 2019 but leveled off in 2020 and 2021. Open interest remained roughly unchanged throughout.
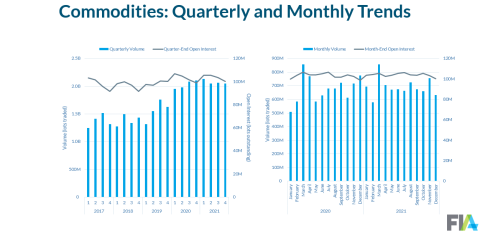
Beneath this placid surface, however, trading volume was affected by several crosscurrents, with certain markets growing very rapidly and others quite the opposite.
Starting with the energy sector and looking at just the top 20 contracts by volume, three trends emerge. First, at the top of the list is the Brent crude oil futures traded on the Moscow Exchange. Although this contract had higher volume than any other energy contract in the world, it is a very small contract in terms of size. The contract is based on just 10 barrels of oil, making it 100 times smaller than the Brent futures traded on ICE and CME. In effect, it is a micro contract, easily accessible to individual traders but of limited interest to commodity trading firms or corporate hedgers.
The second most actively traded contract was the fuel oil futures listed on the Shanghai Futures Exchange. This contract is essentially a mini contract; it is based on 10 metric tons of oil, making it 10 times smaller than the comparable international contract, the gas oil contract at ICE Futures Europe.
Both contracts suffered from steep declines in trading volume in 2021, which offset gains in other parts of the energy market and depressed the overall level of trading activity in energy. Both contracts also have relatively low open interest, which highlights the speculative nature of trading in these contracts.
In contrast, the TTF gas futures had explosive growth in trading volume, and the open interest in this contract, although unchanged on the year, was extremely high compared to the rest of the energy sector. This contract is traded on ICE Endex, the Amsterdam-based futures exchange that is part of the Intercontinental Exchange group of companies. The contract has steadily gained in popularity among energy producers and trading companies because of its value as a benchmark for natural gas prices in Europe. In addition, with the US becoming a major exporter of natural gas, this contract has taken on additional importance for companies involved in the transport of LNG from the US to Europe and Asia. Total volume hit 41.6 million contracts in 2021, up 52% compared to 2020. Open interest at year-end was 1.7 million contracts, almost as large as the major oil contracts and much larger than its US counterpart, the Henry Hub natural gas futures traded on the New York Mercantile Exchange.
Top 20 energy futures and options contracts
| Rank | Contract | Jan-Dec 2021 Volume | Volume % Change | 2021 December Open Interest |
Open Interest % Change |
| 1 | Brent Oil Futures, Moscow Exchange | 579,590,791 | -22.00% | 929,796 | -12.40% |
| 2 | Fuel Oil Futures, Shanghai Futures Exchange | 276,993,809 | -42.00% | 493,517 | 11.80% |
| 3 | WTI Light Sweet Crude Oil (CL) Futures, New York Mercantile Exchange | 248,314,481 | -9.40% | 1,866,914 | -13.40% |
| 4 | Brent Crude Oil Futures, ICE Futures Europe | 243,666,353 | 5.10% | 2,113,433 | -13.90% |
| 5 | Bitumen Futures, Shanghai Futures Exchange | 140,463,222 | -31.40% | 678,755 | 2.60% |
| 6 | Henry Hub Natural Gas (NG) Futures, New York Mercantile Exchange | 97,588,795 | -19.20% | 1,108,463 | -5.20% |
| 7 | Thermal Coal (ZC) Futures, Zhengzhou Commodity Exchange | 84,236,073 | 37.70% | 33,534 | -85.40% |
| 8 | Gas Oil Futures, ICE Futures Europe | 82,713,016 | -2.10% | 634,545 | -30.70% |
| 9 | Coke Futures, Dalian Commodity Exchange | 59,132,978 | 2.90% | 32,480 | -84.60% |
| 10 | Hard Coking Coal Futures, Dalian Commodity Exchange | 58,305,922 | 120.60% | 48,363 | -62.50% |
| 11 | WTI Light Sweet Crude Oil Futures, ICE Futures Europe | 51,721,597 | 3.20% | 428,582 | -9.10% |
| 12 | RBOB Gasoline Physical (RB) Futures, New York Mercantile Exchange | 47,837,998 | 2.90% | 294,317 | -29.00% |
| 13 | Medium Sour Crude Oil Futures, Shanghai International Energy Exchange | 42,645,180 | 2.50% | 67,512 | -20.30% |
| 14 | Dutch TTF Gas Futures, ICE Endex | 41,607,968 | 52.30% | 1,713,918 | -1.40% |
| 15 | Natural Gas Futures, Multi Commodity Exchange of India | 40,032,148 | -13.20% | 13,482 | 57.30% |
| 16 | NY Harbor ULSD (HO) Futures, New York Mercantile Exchange | 38,711,497 | -12.00% | 303,334 | -16.40% |
| 17 | Heating Oil Futures, ICE Futures Europe | 37,304,745 | 3.60% | 31,617 | 2.00% |
| 18 | Liquefied Petroleum Gas Futures, Dalian Commodity Exchange 1 | 35,060,253 | -27.30% | 148,961 | 128.40% |
Turning to the agricultural sector, the ranking of the top 20 contracts by volume confirms the importance of the Chinese exchanges. Fifteen out of the top 20 are listed on one of the Chinese exchanges, and most of the growth in this sector is on those exchanges. Although China's agricultural futures contracts tend to be smaller than their US counterparts in terms of the contract size, the scale of the trading volume is putting them on the radar of traders in the West in terms of price discovery. And in some areas, there is no counterpart in Western markets. For example, futures on wood pulp, a key ingredient for paper manufacturing, were introduced several times on Western exchanges but never succeeded until the Shanghai Futures Exchange listed wood pulp futures in 2018. Last year the volume in that contract reached 119 million contracts, up 247% from the previous year, and it has become a key source of price discovery for the global market in pulp and paper.
Top 20 agricultural futures and options contracts
| Rank | Contract | Jan-Dec 2021 Volume | Volume % Change | 2021 December Open Interest |
Open Interest % Change |
| 1 | Soybean Meal Futures, Dalian Commodity Exchange | 360,388,172 | 0.30% | 2,214,455 | -3.90% |
| 2 | Rapeseed Meal (RM) Futures, Zhengzhou Commodity Exchange | 268,927,210 | 68.20% | 596,926 | 24.60% |
| 3 | Soybean Oil Futures, Dalian Commodity Exchange | 229,383,502 | 32.50% | 802,216 | 36.60% |
| 4 | RBD Palm Olein Futures, Dalian Commodity Exchange | 226,614,036 | -28.10% | 608,154 | 46.10% |
| 5 | Corn Futures, Dalian Commodity Exchange | 189,287,113 | 6.50% | 1,464,172 | -5.90% |
| 6 | Natural Rubber Futures, Shanghai Futures Exchange | 121,600,877 | 20.50% | 312,825 | 11.70% |
| 7 | Woodpulp Futures, Shanghai Futures Exchange | 119,222,581 | 247.00% | 383,529 | 32.70% |
| 8 | White Sugar (SR) Futures, Zhengzhou Commodity Exchange | 116,457,963 | -6.50% | 538,771 | -3.60% |
| 9 | Cotton No. 1 (CF) Futures, Zhengzhou Commodity Exchange | 113,523,632 | 4.80% | 573,599 | -9.80% |
| 10 | Rapeseed Oil (OI) Futures, Zhengzhou Commodity Exchange | 112,755,176 | 6.90% | 258,119 | 59.90% |
| 11 | Apple (AP) Futures, Zhengzhou Commodity Exchange | 105,492,739 | 67.40% | 232,728 | -29.30% |
| 12 | Corn Futures, Chicago Board of Trade | 86,901,950 | -3.20% | 1,512,771 | -13.60% |
| 13 | Egg Futures, Dalian Commodity Exchange | 59,397,983 | -55.00% | 238,767 | -28.40% |
| 14 | Corn Starch Futures, Dalian Commodity Exchange | 56,625,060 | 100.10% | 244,394 | 40.10% |
| 15 | Soybean Futures, Chicago Board of Trade | 53,324,458 | -12.80% | 631,627 | -29.00% |
| 16 | No. 1 Soybean Futures, Dalian Commodity Exchange | 49,558,416 | -16.60% | 247,683 | 130.40% |
| 17 | Soybean Meal Options, Dalian Commodity Exchange | 37,992,814 | 26.10% | 452,713 | 17.50% |
| 18 | Soybean Oil Futures, Chicago Board of Trade | 32,675,376 | -0.90% | 372,571 | -20.60% |
| 19 | Corn Options, Chicago Board of Trade | 31,648,268 | 29.70% | 1,045,629 | -23.30% |
| 20 | Sugar #11 Futures, ICE Futures U.S. | 31,002,757 | -22.40% | 867,292 | -18.70% |
Last but not least, the metals sector. Here again, the Chinese exchanges have a big role. Five of the top 10 contracts on the list of the top 20 contracts by volume are related to the steel industry in China. These contracts include not only finished products such as rebar and coil but also raw materials for the steel-making process such as iron ore, ferro silicon and silicon manganese.
Turning to the London Metal Exchange, the most important center for metals trading at the global level, metal producers and other industrial users reduced their positions in 2021. Year-end open interest was down in aluminium and copper, LME's two most heavily traded contracts, by 21% and 34%, respectively, compared to the previous year.
Top 20 metals futures and options contracts
| Rank | Contract | Jan-Dec 2021 Volume | Volume % Change | 2021 December Open Interest |
Open Interest % Change |
| 1 | Steel Rebar Futures, Shanghai Futures Exchange | 655,986,710 | 79.20% | 2,553,290 | 62.10% |
| 2 | Silver Futures, Shanghai Futures Exchange | 231,457,606 | -35.20% | 666,393 | -7.80% |
| 3 | Hot Rolled Coil Futures, Shanghai Futures Exchange | 220,715,917 | 168.00% | 1,015,803 | 52.60% |
| 4 | Iron Ore Futures, Dalian Commodity Exchange | 174,412,025 | -38.70% | 1,074,078 | 77.00% |
| 5 | Nickel Futures, Shanghai Futures Exchange | 172,165,580 | -4.20% | 296,290 | -5.00% |
| 6 | Aluminum Futures, Shanghai Futures Exchange | 131,457,870 | 148.70% | 498,116 | 54.80% |
| 7 | Ferrosilicon (SF) Futures, Zhengzhou Commodity Exchange | 95,241,196 | 203.90% | 128,426 | 27.60% |
| 8 | Gold Futures, Borsa Istanbul | 93,557,193 | -32.00% | 656,618 | -62.10% |
| 9 | Silicon Manganese (SM) Futures, Zhengzhou Commodity Exchange | 80,496,126 | 77.70% | 161,937 | 7.70% |
| 10 | Zinc Futures, Shanghai Futures Exchange | 69,341,255 | 14.90% | 210,293 | 13.80% |
| 11 | Refined Silver Futures, Moscow Exchange | 67,378,342 | 0.50% | 390,936 | -0.90% |
| 12 | Copper Futures, Shanghai Futures Exchange | 64,107,155 | 12.10% | 332,180 | 5.50% |
| 13 | Gold (GC) Futures, Commodity Exchange (COMEX) | 58,464,997 | -25.20% | 512,591 | -8.50% |
| 14 | Aluminium Futures, London Metal Exchange | 57,670,339 | -7.00% | 730,421 | -21.30% |
| 15 | Gold Futures, Moscow Exchange | 48,466,085 | 47.60% | 195,852 | 21.00% |
| 16 | Silver Micro Futures, Multi Commodity Exchange of India | 47,357,929 | -1.30% | 115,451 | 180.50% |
| 17 | Gold Futures, Shanghai Futures Exchange | 45,412,161 | -13.30% | 177,528 | -5.50% |
| 18 | Stainless Steel Futures, Shanghai Futures Exchange | 40,468,072 | 273.60% | 113,441 | -33.90% |
| 19 | Copper Grade A Futures, London Metal Exchange | 29,691,402 | -8.90% | 296,274 | -21.90% |
| 20 | Tin Futures, Shanghai Futures Exchange | 27,012,409 | 102.90% | 77,180 | 47.00% |