|
ADVERTISEMENT
|
For the second year in a row, the global listed derivatives markets enjoyed a record level of trading activity. The total number of futures and options traded on exchanges worldwide reached 34.47 billion contracts in 2019, up 13.7% from the previous year.
The Asia-Pacific region continued to be the largest in terms of both the number of contracts traded and the rate of growth. The total number of futures and options traded on APAC exchanges rose 29% to 14.49 billion, with exchanges in China and India accounting for nearly all the growth.
Trading activity in Latin America also rose rapidly, mainly due to a large increase in the number of equity index and interest rate contracts traded on Brazil's B3. That exchange had volume of 3.88 billion contracts in 2019, up 51% from 2018.
In contrast, trading activity in Europe and North America trended downward from the previous year, with declines in many of the well-known benchmark contracts offsetting increases in other areas. Total volume in Europe slid 4.4% to 5.03 billion contracts, with interest rate activity in particular depressed by lower levels of volatility. Total volume on North American exchanges declined 2.8% to 10.27 billion contracts in 2019, mainly due to double-digit decreases in the trading of equity index futures and options.
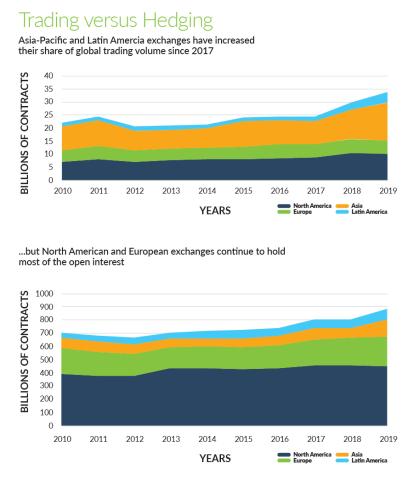
As a result of the diverging regional trends, the Asia-Pacific and Latin American regions increased their share of global trading volume. Exchanges in Asia-Pacific accounted for 42% of global volume, the highest in at least a decade. Exchanges in Latin America accounted for 12% of global volume, an all-time record.
Structural differences
The contrasting trends in trading activity highlights several structural differences in these markets. In the more mature markets of North America and Western Europe, a large amount of trading volume comes from institutional investors and corporate hedgers that use listed derivatives to manage changes in their market risk exposures. Over the last decade, several secular trends impacted the overall level of trading in these markets, notably the post-crisis regulatory reforms, the shift from over-the-counter to exchange- traded products, and greater electronification of trading. But in 2019, those long-term structural changes played less of a role, and instead the main drivers of trading activity were one-off external factors such as reversals in monetary policy, declining volatility in the stock market, and fluctuations in the supply and demand of industrial commodities.
The environment was quite different in the more rapidly growing markets in Brazil, Russia, India and China. In those markets, speculative trading tends to outweigh hedging activity, and most of the increase in trading took place in relatively smallsized futures and options that are popular with retail investors.
This structural difference is reflected in the fact that the North American and European markets have much higher levels of open interest, as measured by the number of positions outstanding at the end of the year. Open interest tends to be higher when futures and options are used for managing market risk exposures, and tends to be lower in contracts that are predominantly driven by short-term speculation.
Total open interest worldwide at the end of 2019 was 900.1 million contracts, up 8.8% from the end of 2018. North America had 50% of total open interest, by far the largest share, and Europe had 24%. The Asia-Pacific region, despite having a greater volume of trading than the other regions, had less than 9% of the global open interest. That difference reflects the more speculative character of trading in Asia-Pacific with higher levels of retail participation, smaller contract sizes, and relatively low amounts of long-term positioning for risk management.
Nifty options take off
The best example of this speculative trend was the Bank Nifty options contract listed on the National Stock Exchange of India. Since the exchange introduced weekly expirations in 2016, these options have become extremely popular with retail investors and proprietary traders. The index has only 12 constituents, giving it greater volatility than other broader indices, and the amount of premium required to buy one of these options is relatively low.
Nearly 3 billion of these options traded in 2019, making it the most heavily traded individual contract anywhere in the world. On the other hand, open interest in this product was just 704,000 contracts at year-end, which indicates that most positions are held for a very short period of time.
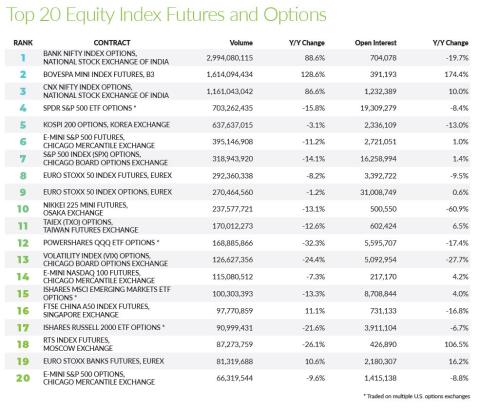
In comparison, the SPDR S&P 500 ETF options, the most actively traded equity index option in North America, had volume of 703.3 million contracts in 2019, about one quarter of volume in the Bank Nifty option, but open interest of 19.3 million contracts at year-end, approximately 27 times the amount outstanding in the Bank Nifty option. Similarly, the Euro Stoxx 50 option listed on Eurex, the most actively traded equity index option in Europe, had volume of 270.5 million contracts in 2019, less than a tenth of the volume in the Bank Nifty option, but open interest of 31 million contracts at year end, more than 40 times the amount outstanding in the Bank Nifty option.
These differences should not be overstated, however. The North American exchanges benefit from substantial retail investor participation in certain sectors such as ETF options and precious metals futures and options. And the exchanges are working to expand that participation, as shown by CME's recent launch of micro-sized versions of four equity index futures and the rising popularity of CBOE's mini S&P option. By offering contracts that are one-tenth the size of the standard versions of these contracts, the exchanges are attempting to make their equity index products more affordable to retail investors interested in speculating in the direction of the U.S. stock market. More than 87.6 million CME micro equity index futures have changed hands since their launch in May 2019, and CBOE's XSP volume exploded in 2019, jumping 252% to 17.2 million contracts.
Crude oil and iron ore
Equally important, some of the BRIC markets are taking steps to alter the composition of the participants. The Chinese authorities, for example, are expanding the range of industrial commodities that can be hedged with futures, opening certain contracts to non-resident traders and investors, and allowing foreign brokers to take a more active role in the mainland futures markets.
Two examples of this trend are the crude oil futures listed on the Shanghai International Futures Exchange and the iron ore futures listed on the Dalian Commodity Exchange. The INE was established with the explicit purpose of developing a regional benchmark for crude oil prices, and the rules of the exchange have been designed to attract foreign participation. Total volume in this contract was 34.6 million contracts in 2019, up 30% from the previous year. Trading activity in this contract is still just a fraction of the volume in the Brent and WTI contracts, the two leading international benchmarks, but it has become the most actively traded oil contract east of the Suez.
The iron ore futures contract has been in existence for longer, but the market was difficult to access from overseas until May 2018, when new rules took effect that allowed foreign participation. According to the exchange, more than 100 foreign entities traded iron ore futures in 2019. Total volume in the contract rose 25% to 296.5 million contracts, making it the second-most heavily traded metals contract in the world. And open interest rose 48% to 702,000 contracts, well ahead of the comparable offshore contract, the iron ore futures traded on the Singapore Exchange. Both contracts are based on the same amount of iron ore—100 metric tonnes—so the fact that Dalian's contract now has greater volume and open interest indicates that it has become the leading center for both price discovery and risk management in this commodity.
NSE moves past CME in volume ranking
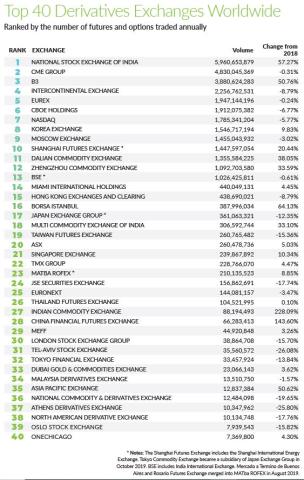
One of the biggest surprises of the year was the explosion in trading activity at the National Stock Exchange of India. More than 5.96 billion derivatives contracts changed hands on NSE in 2019, up 57% from the previous year, with the Bank Nifty options leading the way. That was enough to catapult NSE past CME Group in FIA's global exchange ranking, making it the largest exchange in the world in terms of contract volume.
CME had a very good year by historic standards, but total volume was down slightly from 2018. The same was true at its peers in Europe and North America. CBOE, Eurex, Intercontinental Exchange, and Nasdaq all saw lower levels of trading activity compared to 2018.
Looking at the top 20 exchanges, the contrast in regional trends was obvious. The five largest exchanges in BRIC countries had double digit growth rates, while the leading exchanges in North America and Western Europe were down from the previous year.
Open interest tells a different story, however. Open interest at those five BRIC exchanges was up almost as much as volume, but from a low base. And open interest at the traditional majors such as CME, Eurex and ICE was much higher, and in some cases grew at a healthy rate.
Rates complex hits another record
Trading of interest rates futures and options had another record year, with volume up 4.6% to 4.76 billion contracts. This was the fourth straight year that trading in this category grew year-over-year. Since the post-crisis low in 2012, when volume fell to 2.89 billion contracts, total volume in this category has risen by 64%.
Open interest has followed a similar trajectory. Total open interest worldwide at year-end 2019 was 219.3 million contracts, up 34% from the previous year, and nearly twice the amount of open interest at the end of 2012. In fact, there were more open positions at year-end in the interest rate category than the equity index category, an indication of how important these products are to banks and other institutions exposed to interest rate risk.
Global trading of interest rate products is dominated by exchanges in Europe and North America, which accounted for 79% of worldwide volume in this category. The two regions are on different tracks, however, in terms of their long-term rate of growth.
Over the last five years, the trading of interest rate futures and options has grown twice as fast in North America than in Europe. Total interest rate volume in North America was 2.68 billion contracts in 2019, up 53% over five years. Total interest rate volume in Europe was 1.1 billion in 2019, up 22% over five years.
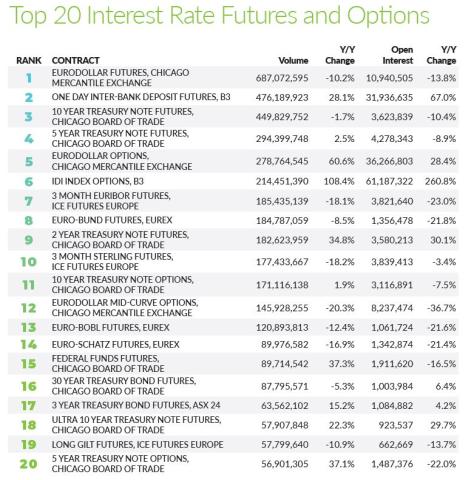
Interest rate options had a particularly strong year in 2019. Trading of Eurodollar options listed on CME jumped 61% to 278.8 million contracts, making it the world's most actively traded interest rate option. Not far behind was the IDI index option listed on Brazil's B3. Trading in these options, which are based on the country's main shortterm interest benchmark, more than doubled in 2019 to reach 214.5 million contracts.
Broad-based rise in commodity trading
Trading volume in commodity futures and options hit a record of 7.22 billion contracts in 2019, up 19% from the previous year. Every category within the commodity sector had a double-digit increase in trading volume except non-precious metals, which was down 5.5% from the previous year.
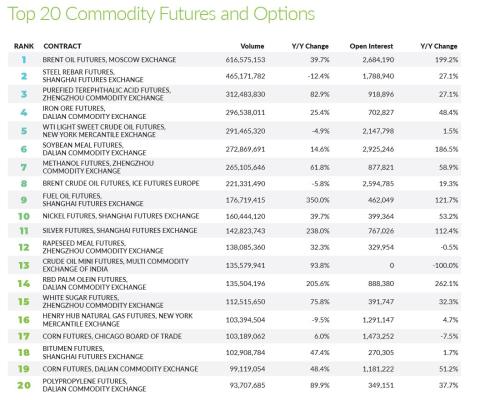
The most actively traded contract within this sector last year was the Brent crude oil futures contract listed on the Moscow Exchange. Total volume in this contract rose 40% to 616.6 million contracts. It should be noted, however, that the contract size is just 10 barrels of oil, a hundred times smaller than the Brent and WTI benchmark contracts traded in London and New York. As with the Bank Nifty options in India, the small size of the Moscow Brent contract and the volatility of the underlying makes it attractive to retail investors and proprietary traders.
For most of the established energy futures and options traded on the major exchanges, trading activity was lower in 2019 than in 2018. The notable exception was the TTF natural gas futures listed on ICE Futures Europe. Volume jumped 93% to 18 million contracts, a record amount for this contract, which is becoming an important benchmark for global trading of liquefied natural gas. Yearend open interest stood at 1.18 million contracts, up 31% from the previous year.
Precious metals futures and options also had an unusually high amount of volume, with triple digit increases in the trading of silver and gold futures listed on exchanges in China and Turkey. In the U.S., the Comex gold futures traded on CME, the main benchmark for the wholesale side of the market, did not benefit from this upsurge in trading, but the SPDR gold ETF options, which trade on multiple U.S. options exchanges, saw trading rise 39%. These options, which are based on an ETF that holds physical gold, are popular with individual traders looking for ways to speculate on the direction of gold prices, and their popularity in 2019 was another example of the global trend towards greater trading on the retail side of the futures and options markets.