Every three years the Bank for International Settlements releases a survey of over-the-counter derivatives markets. The survey is the most comprehensive source of information about the size and structure of these markets, and yields important insights into long-term trends in trading.
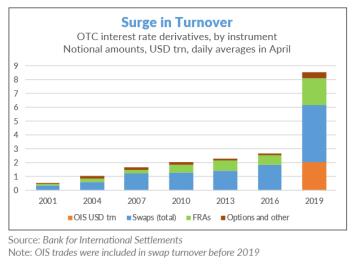
In September the BIS released the data from its most recent survey, which was based on reports submitted by almost 1,300 dealers in 53 countries. That data showed a huge increase in the turnover of interest rate derivatives. Between April 2016 and April 2019, average daily turnover rose from $2.7 trillion to $6.5 trillion, an increase of 143%, an order of magnitude larger than in previous years.
At the time, the BIS commented that this increase "appears to have been driven mainly by increased hedging and positioning," but offered no further explanation. Instead it promised to deliver a deeper analysis later this year.
That analysis has now arrived. On Dec. 8, the BIS released several studies produced by its staff based on the data in the triennial survey. Two of those studies focused specifically on trends in the OTC interest rate derivatives markets.
The BIS staff found that some of the huge growth in trading was driven by one-time factors such as changes in U.S. interest rate policy. They also noted that some of the growth was due to improvements in the collection of data, notably in the area of related-party trading. But the more important driver was structural change: the OTC interest rate derivatives market is becoming more exchange-like in the way that trading takes place.
"In general, structural developments like clearing, compression and automation remade OTC markets so that they more closely resembled exchanges," the BIS staff commented. This contributed to the growth rate for OTC "significantly outpacing" the growth of trading on exchanges, which led to a "relative shift in trading from exchanges to OTC markets."
More use of central clearing
This conclusion was based on several observations. First, an extremely high percentage of all new trades are cleared through central counterparties. In some cases, this is because of regulatory requirements. Following the implementation of post-crisis reforms such as Dodd-Frank, certain types of highly standardized interest-rate derivatives must be cleared, and the BIS staff noted that the clearing rate for those derivatives currently is approaching 100%.
The adoption of central clearing is also being driven by higher capital and margin requirements. Those rules have taken longer to implement but apply more broadly than the mandatory clearing requirements. According to the BIS staff, the rate of clearing for non-mandated forward rate agreements rose from 17% at the end of 2013 to 79% in June 2019, and the rate of non-mandated interest rate swaps rose from 18% to 45% over the same time period.
New players enter the market
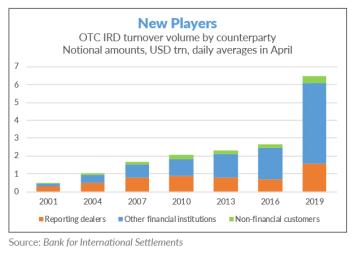
Second, the BIS staff commented that "new players" have entered the market and pointed in particular to investment funds and other asset managers. The survey did not collect data specifically on these players, but in their analysis the staff pointed to three trends that suggest greater participation.
- Total assets under management have increased dramatically. Using data from Lipper, the staff noted that total assets under management rose from $39.2 trillion in June 2016 to $50.9 trillion in June 2019, an increase of 30% over three years.
- Evidence from futures markets shows increased demand for using derivatives. Using the CME Eurodollar contracts as a proxy, the BIS staff observed that positions held by asset managers and leveraged funds rose 37% from April 2016 to April 2019, compared with 18% for dealers.
- Data from the survey show that OTC interest rate derivatives trading by "other financial institutions" is increasing faster than dealers. This category includes asset managers as well as hedge funds, insurance companies, commercial banks and other financials. Trading by "other financial institutions" jumped 156% to $4.53 trillion per day in April 2019, while trading by dealers rose 124% to $1.56 trillion per day.
Falling costs of trading
The third factor driving increased trading of OTC interest rate derivatives was advances in trading technology, and in particular the rise in electronic and automated trading. The BIS staff said that this trend has reduced transaction costs, which boosted the level of trading and "bolstered the presence" of asset managers and other new players.
The survey did not gather data on the method of trading for interest rate derivatives, but the staff pointed to a separate study on the explosion of electronic trading in the OTC FX markets, and commented that automated trading has been on the rise across all derivatives markets in recent years.
The staff also noted the growth of trading on swap execution facilities in the U.S. Trading of interest rate derivatives on these venues rose from $391 billion in April 2016 to $710 billion in April 2019, an increase of 82%. Although not all trading on these venues is negotiated electronically, the staff commented that the infrastructure provided by SEFs "makes it easier to engage in algorithmic trading strategies in OTC markets."
Portfolio compression
In a separate analysis, the BIS staff looked at the size of outstanding positions at the end of June and compared that amount to the end of June 2016. They found that the marked increase in turnover did not lead to a correspondingly large increase in outstanding exposures.
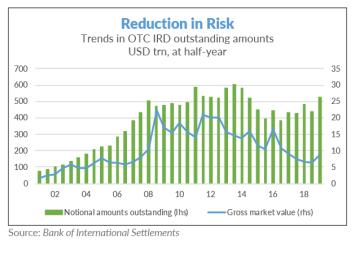
As measured by notional principal, the total amount of outstanding OTC interest rate derivatives reached $524 trillion as of June 2019, up 17% from $447 trillion in June 2016, but down 10% from the $580 trillion outstanding three years earlier. In other words, the stock of outstanding OTC interest rate derivatives is rising much more slowly than the flow of trading activity.
The BIS also measures outstanding amounts by gross market value, which it describes as a "better gauge of amounts at risk." By this measure, the trend is clearly negative. Gross market value of outstanding interest rate derivatives fell from $16.4 trillion in June 2016 to $8.8 trillion in June 2019, a decline of 56%. In other words, the actual amount of risk outstanding in this market fell by almost half over the last three years even as the amount of trading nearly tripled.
The BIS cited two main reasons for this contrasting trend: the increased adoption of central clearing, which allows for the elimination of offsetting positions through multilateral netting, and greater use of portfolio compression. Compression is a process whereby two or more offsetting positions are replaced with a single new trade that leaves the economic exposures materially unchanged. In exchange-traded derivatives markets, this happens automatically when clearinghouses net down offsetting positions.
Portfolio compression in the OTC interest rate derivatives markets has been increasing steadily in recent years, the BIS staff said, in terms of both the sizes of the trades and the frequency of the compression cycles. This not only reduced the overall stock of derivatives positions by eliminating economically redundant positions. They concluded that it also contributed substantially to the dramatic increase in turnover between 2016 and 2019.
"Discussions with reporting dealers suggest that including compression trades can boost reported turnover by 40% to 60% for some dealers," the BIS staff said. "Compression trades may thus account for a good portion of the increased turnover."
The staff added that although there are no hard data to provide a precise estimate, data from LCH, the largest clearinghouse for OTC interest rate derivatives, suggests that compression trades explain no more than 25% of the increase in turnover from 2016 to 2019 and probably less. "in other words, a generous estimate of compression trades would lower the growth of IRD turnover between 2016 and 2019 from 143% to around 110%," they said.
Swaps vs. futures
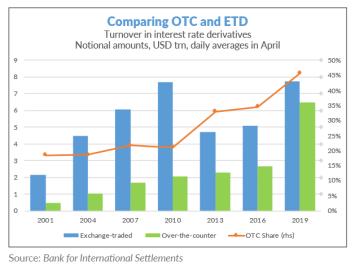
The BIS staff also estimated the notional value of trading in the interest rate futures and options markets, and observed that turnover in OTC markets grew more than twice as fast as turnover in exchange-traded markets.
Turnover in exchange-traded interest rate derivatives rose from $5.07 trillion per day in April to $7.74 trillion per day in April 2019, according to the BIS. That works out to a growth rate of 53%, the largest increase since the financial crisis, but well short of the 143% rate of growth in OTC interest rate derivatives.
The BIS staff commented that since 2010 there has been a steady shift in the overall balance of trading from exchange to OTC trading. OTC interest rate derivatives accounted for 46% of daily trading volume in global interest rate derivatives markets in April 2019, versus 35% in April 2016, 33% in April 2013, and 21% in April 2010. To put it another way, the exchanges' share of the global interest rate derivatives markets, measured by notional value, has fallen from nearly 80% in 2010 to 54% in 2019.