A Surge in Interest Rate Trading in North America Helps Offset a Decline in Commodity Trading in Asia-Pacific
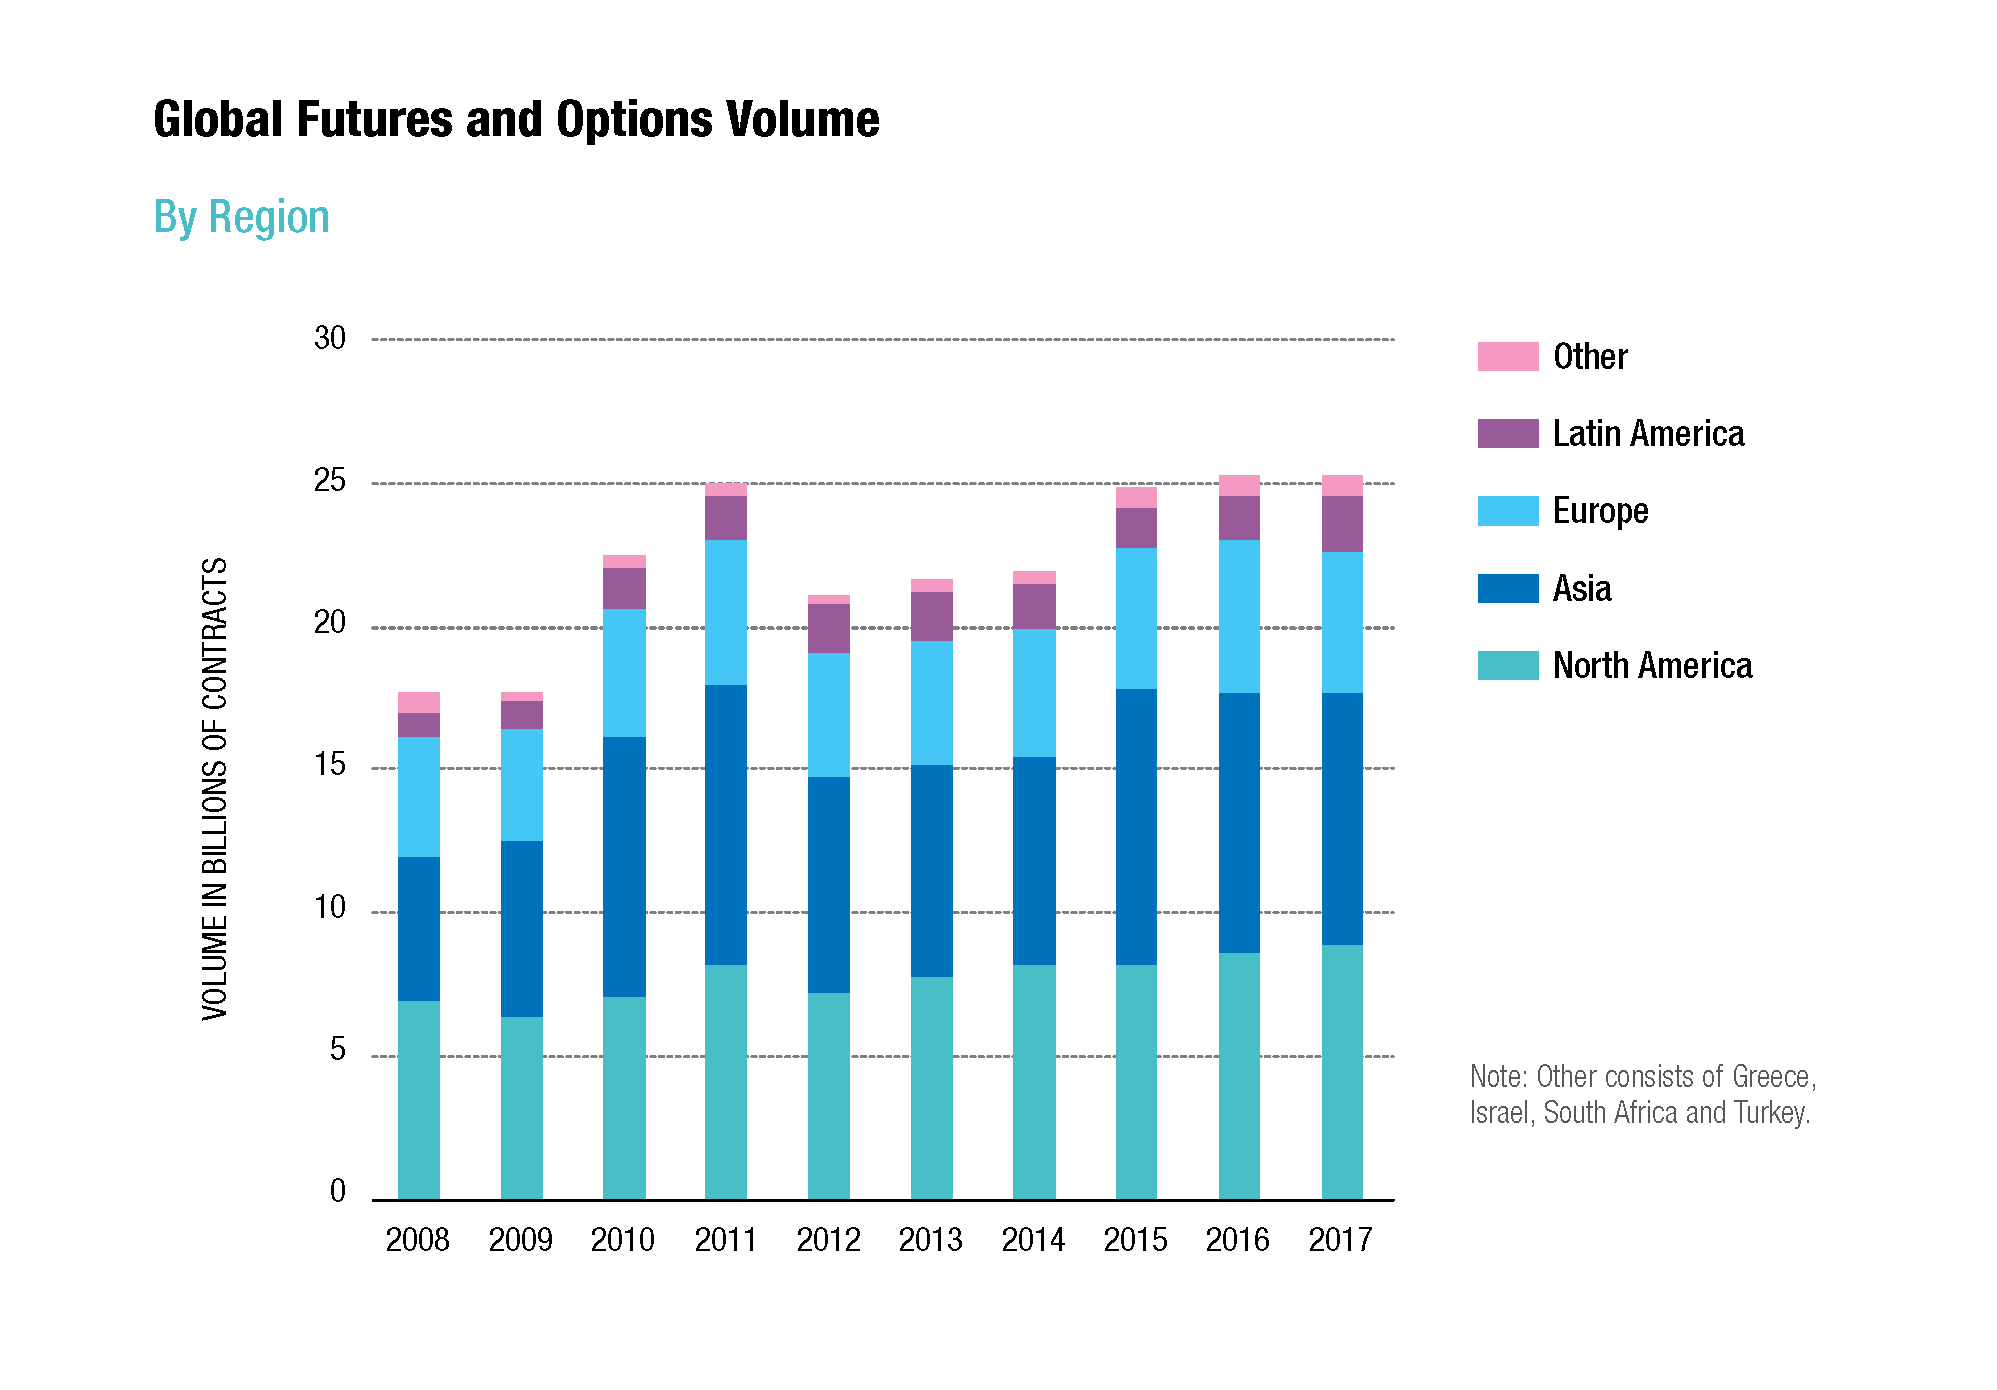
At the highest level, 2017 looks like an unexceptional year in the global exchange traded derivatives markets. The overall level of trading activity, measured by the number of contracts traded on exchanges, was roughly the same as the year before. In fact, the last three years have stayed at the same level—right around 25 billion contracts traded.
Beneath the surface, however, there were some signicant developments in 2017. Trading activity in interest rate futures and options picked up signicantly in North America and Europe, reflecting expectations of higher interest rates. Trading activity in Asia-Pacific declined, however, mainly due to a decrease in the trading of commodity futures in China.
Several exchanges were boosted by double-digit increases in trading volume. Brazil's B3 jumped to number five in the exchange ranking, ahead of both Nasdaq and Eurex. The Korea Exchange's volume soared 46.5%, thanks to a resurgence of trading in its Kospi 200 index options. But those gains were o ffset by declining volume on other exchanges. In China, for example, all three commodity futures exchanges had a down year, with volume on Zhengzhou Commodity Exchange falling 35%.
In other words, 2017 was not a year with a single theme. Instead it was a year of many themes, a year when certain long-lasting trends came to an end and new trends began to emerge. Markets that had been very quiet for a long time began to come back to life, and other markets that had been extremely active showed signs of cooling off.
This article will highlight some of these trends, focusing on the areas that showed the greatest promise of growth. The article is based on statistics from more than 75 exchanges operated by 54 parent companies. The statistics are based on the number of futures and options contracts traded, rather than the value of that trading, and include volume from transactions that are negotiated away from the exchange's central limit order book and then are reported into exchanges for clearing. The statistics do not include contracts for differences, warrants or exchange-traded funds.
Surge of Interest Rate Activity
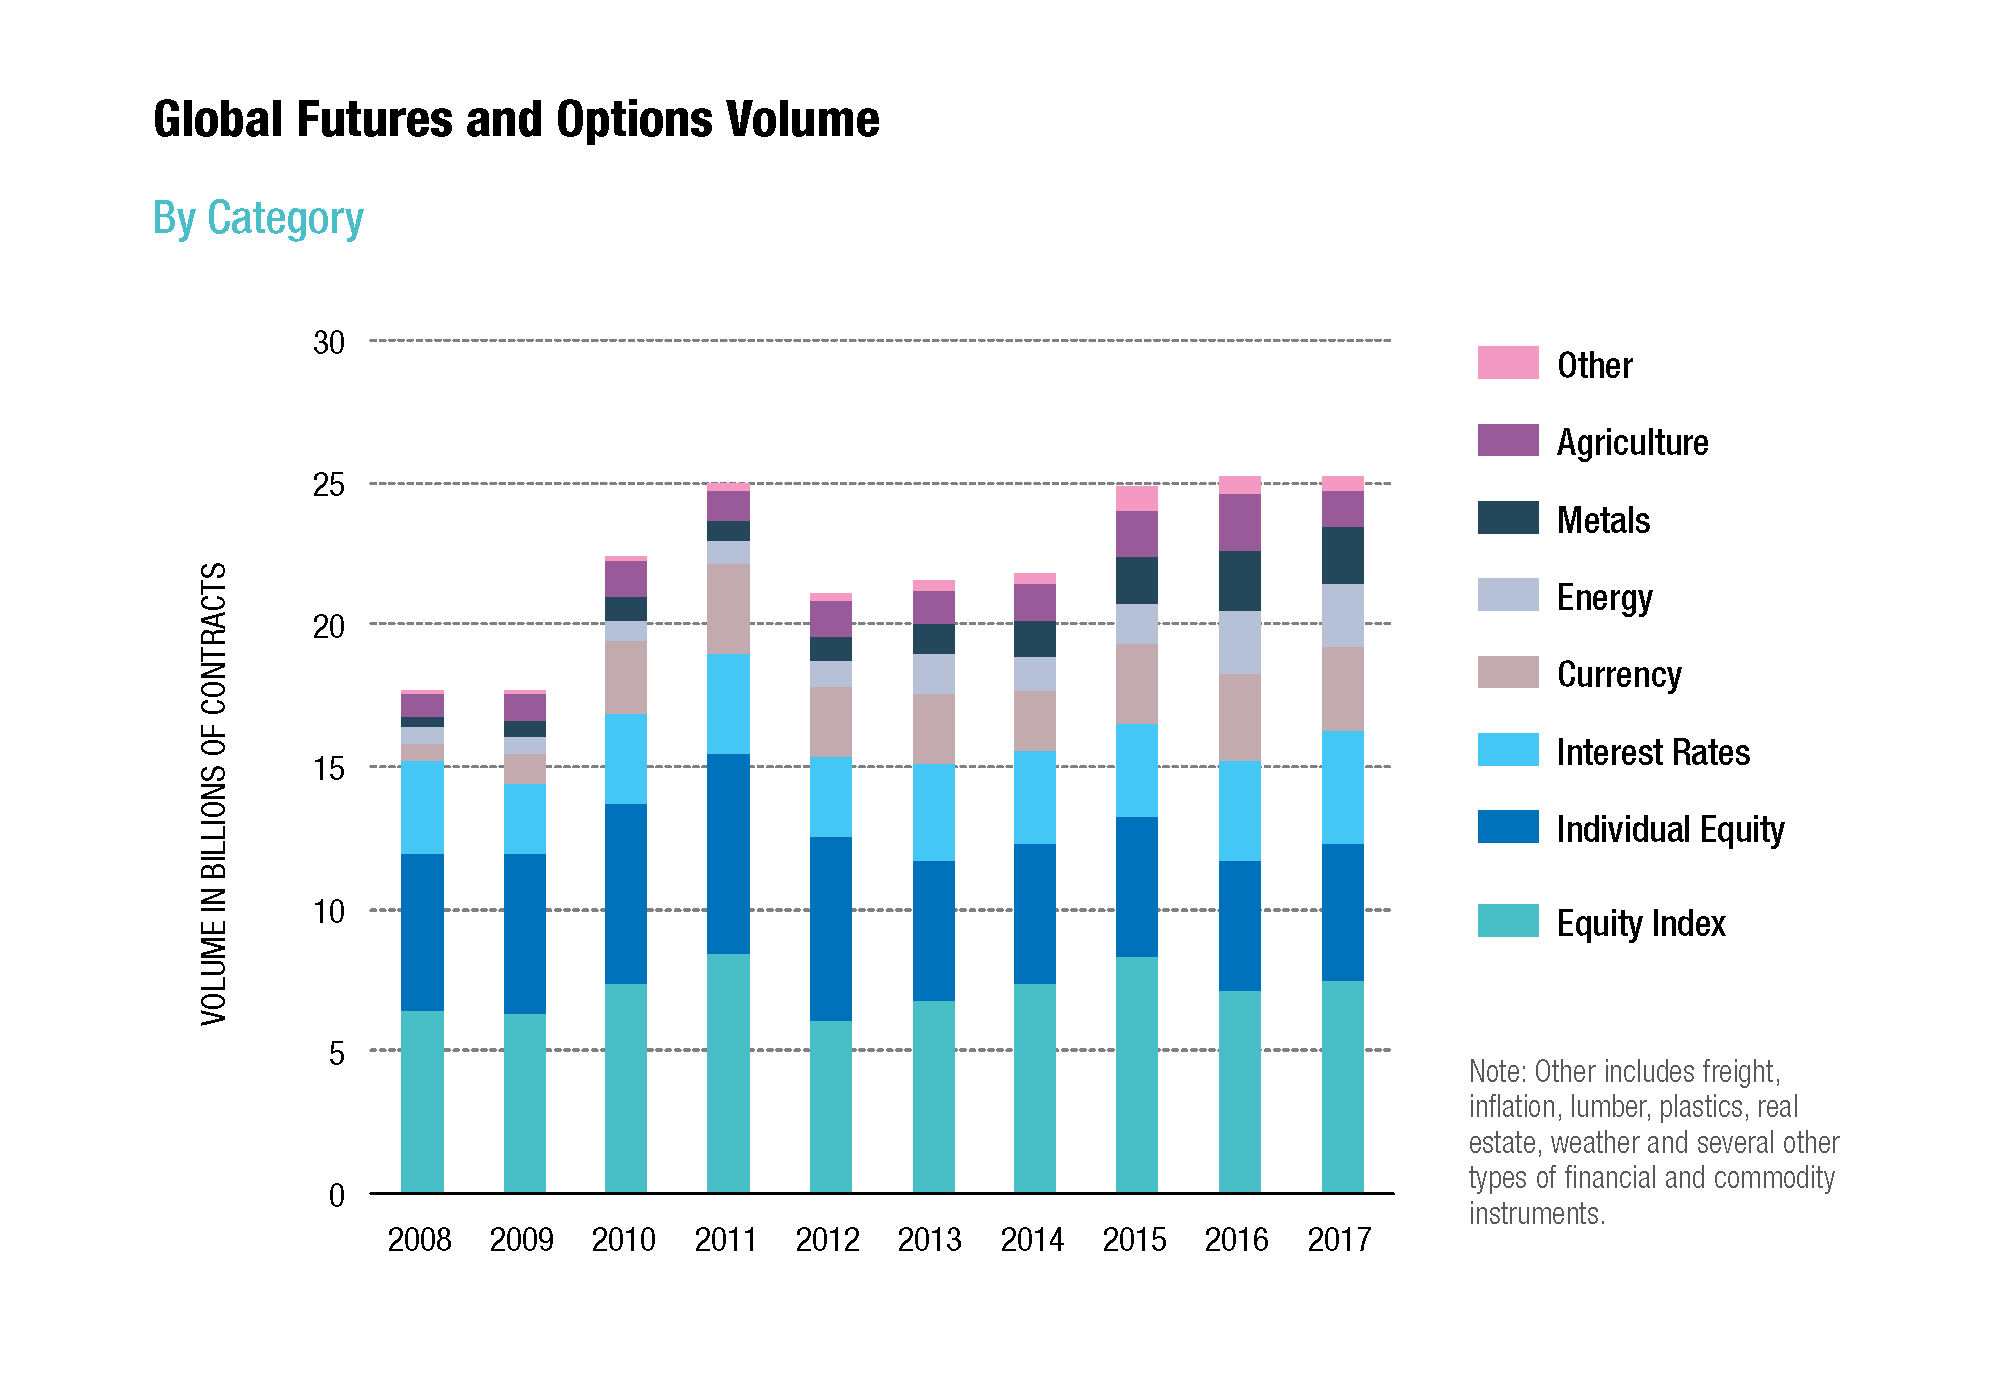
Total worldwide volume in 2017 was 25.2 billion contracts, which was down 0.1% from the prior year. The total number of futures traded on exchanges fell 6.6%, while total options volume rose 11%. In terms of categories, the trading of financial futures and options rose while trading of commodity futures and options fell. The interest rate category rose the most, with volume up 12.9% to 3.97 billion contracts. The agricultural category declined the most, down 32.4% to 1.31 billion contracts.
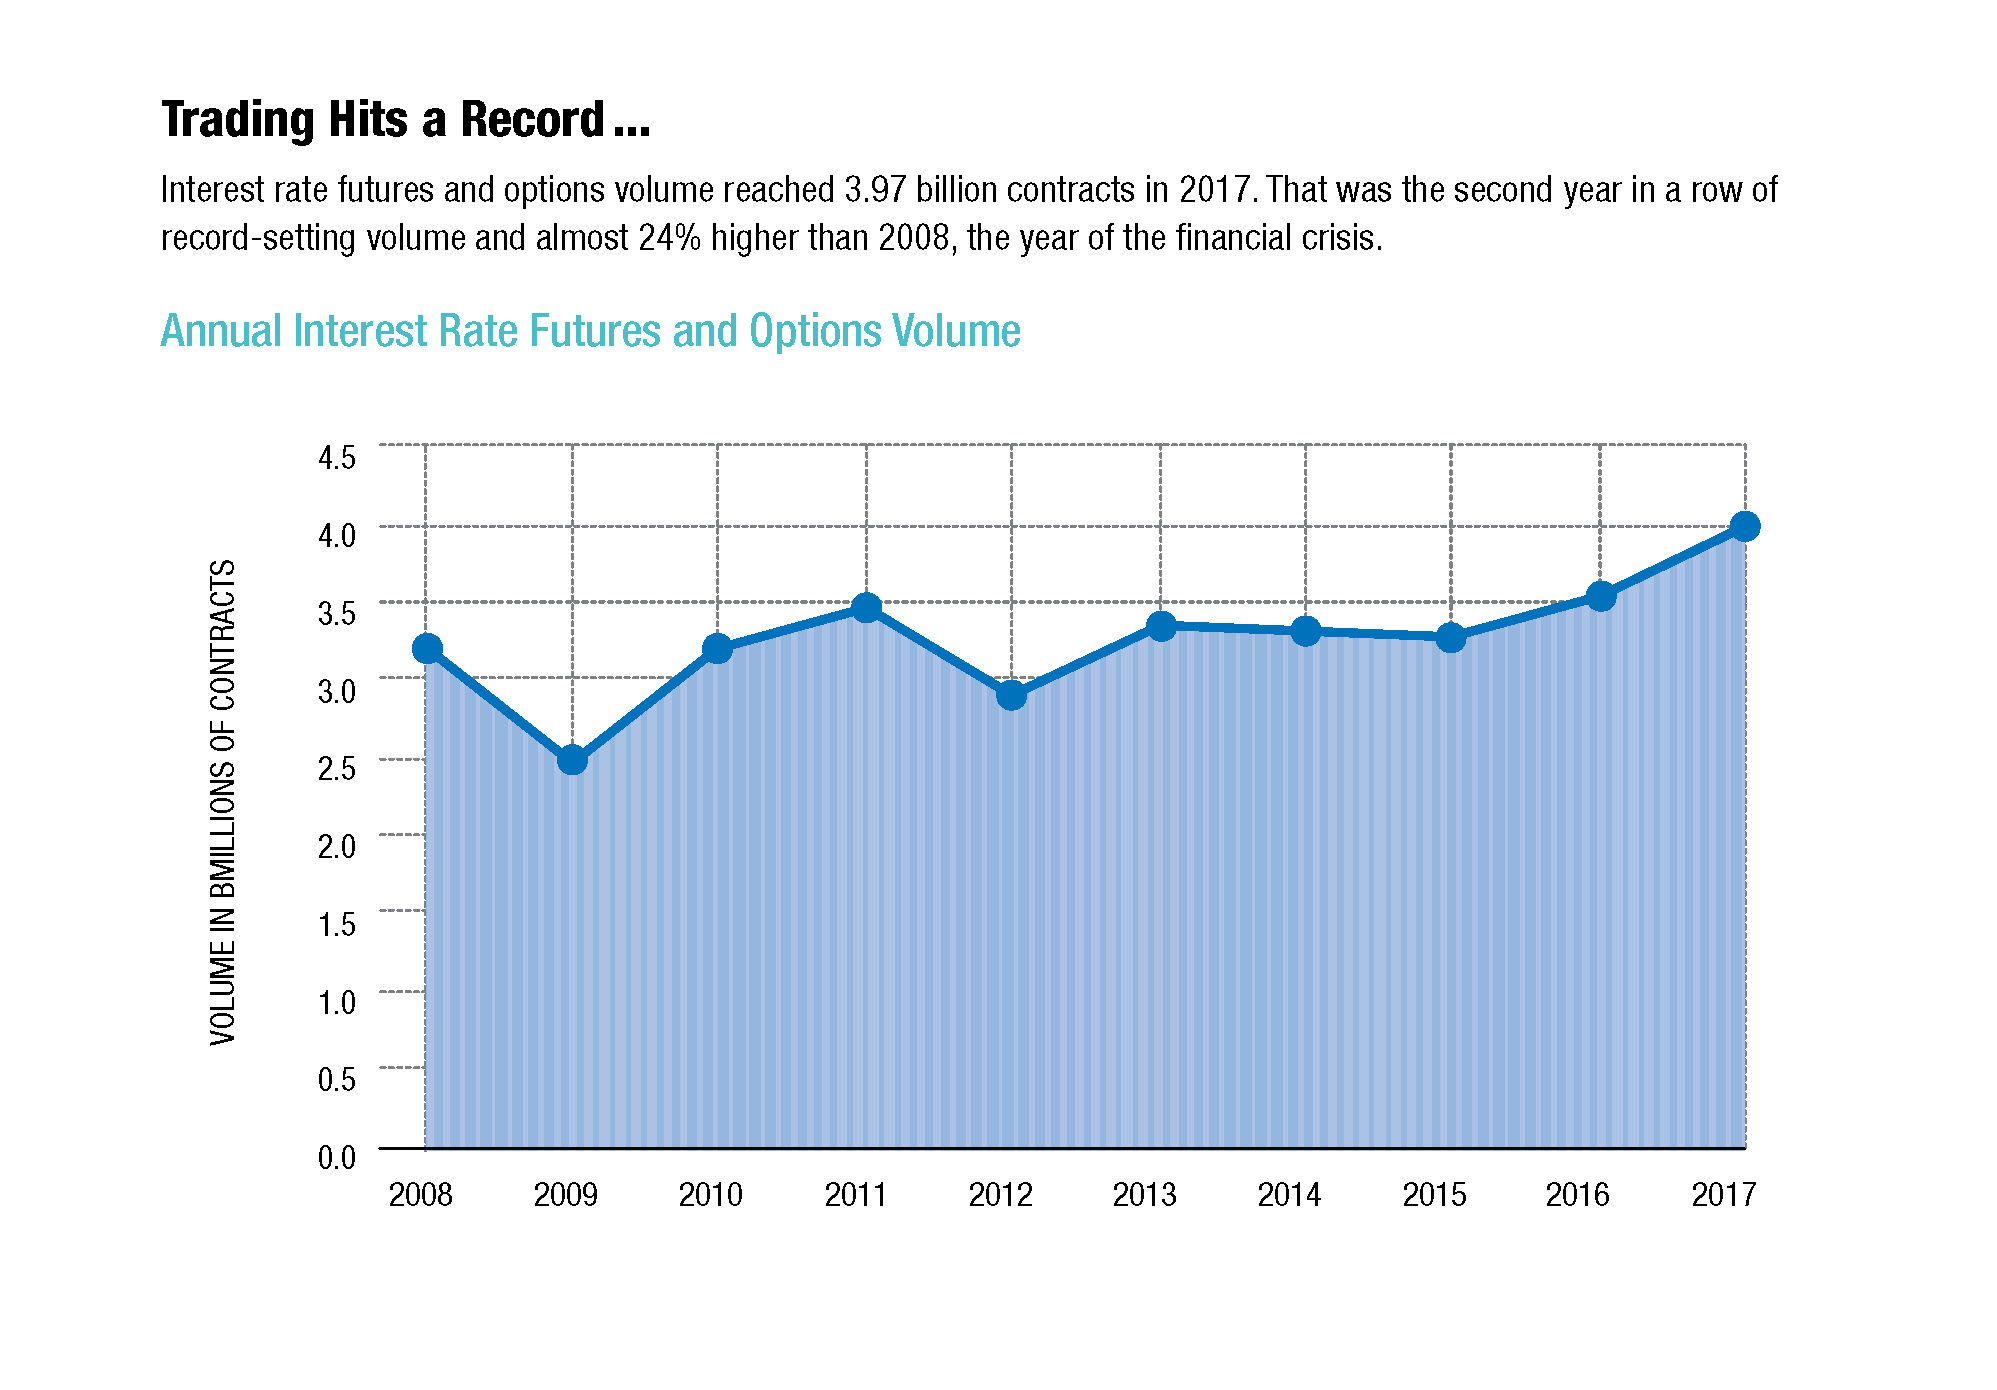
This is the second year in a row that interest rate volume has increased, and the trend appears to be increasing in strength.
Looking back over the last 10 years, we can see that volume declined in the first few years after the financial crisis, then bounced up and down until 2015. Trading picked up in 2016 to 3.52 billion contracts, setting a new record for this category, then surged to 3.97 billion contracts in 2017. That not only set a record, it was also almost 24% higher than the level of interest rate trading volume in 2008, the year of the financial crisis.
One of the interesting features of this trend was the starring role played by the well-established benchmark interest rate contracts in Europe and North America. Over the last decade, much of the growth in this industry has come from new contracts or emerging markets. This time around, the growth came from contracts that have been around for many years, and the surge in growth appears to be driven by greater interest in using these contracts for risk management.
The growth trend was particularly strong among short-term interest rate contracts. One of the most notable was the Euribor futures contract traded on ICE Futures Europe. Trading activity in this contract, the main benchmark for short-term interest rates in Europe, had been depressed for years due to the monetary policy environment in Europe. In 2017 the Euribor futures market exploded, with volume jumping 46.3% to 197.3 million contracts. The three-month sterling futures, which tracks short-term rates in the U.K., also took off in 2017, with volume surging 29.2% to 198.9 million.
A similar trend was seen on Eurex, the other main interest rate futures market in Europe. Trading in the exchange's Euro schatz futures, which tracks a two-year benchmark for European government debt, rose 16.8% to 86.0 million. Options on this contract grew even faster, rising 20% to 17.3 million.
In the U.S., the level of trading activity in Eurodollar futures, the main benchmark for short-term rates, did not increase, but the mid-curve options on Eurodollar futures did. These are short-dated options on long-dated futures. In other words, they provide a way for market participants to take a view on where short-term rates will be a year from now, or two years from now, or even three years. In 2017, 190 million mid-curve Eurodollar options traded on CME Group, an increase of 49.5 million contracts or 35.2% from 2016.
CME's Fed Funds futures, which track another important short-term rate, also saw a large increase in trading activity. The total volume for 2017 jumped to an all-time high of 48 million contracts, an increase of 14.7 million or 44.1% from 2016. Farther out on the curve, futures on the 10-year U.S. Treasury note, the most actively traded contract in the Treasury complex, rose 7% to 375.3 million, and options on the 10-year Treasury note futures jumped 30.5% to 128.5 million.
The main driver for this broad-based increase in trading volume was the change in the macro-economic climate, and in particular the shifts in monetary policy in the U.S. and Europe. By the end of 2017, the U.S. interest rate market was pricing in expectations of three more interest rate hikes by the Fed in 2018. In October, the European Central Bank announced a reduction in its asset purchases, a signal that its quantitative easing policy was coming to an end, and in November, the Bank of England made its first interest rate hike in more than a decade.
The benchmark futures contracts were not the only ones that saw an increase in trading, however. 2017 marked a breakthrough for a different type of product—options on exchange-traded funds that hold fixed income securities. These ETFs have become popular among institutional investors as an alternative to holding the actual securities, and options on these ETFs, which trade on multiple U.S. options exchanges, now rank among the most actively traded interest rate contracts in the derivatives universe. The most active in 2017 was the options on the iBoxx High Yield Corporate Bond ETF. Volume in this contract rose 25.2% to 21.4 million contracts.
Two other markets are worth highlighting. The first is Brazil's B3, the successor to BM&F, which has a well-established suite of interest rate contracts led by the ID futures, which tracks a one-day interbank deposit rate. Volume in this contract rose 17.1% to 354.4 million contracts, making it the third most actively traded interest rate futures contract in the world. The IDI options, which are based on the same short-term interest rate, rose 96.2% to 98.5 million contracts, making it the third most actively traded interest rate options contract in the world.
The other is China. In March 2015, the China Financial Futures Exchange launched futures on the 10-year government bond. Access to the market continues to be relatively restricted, but volume is ticking up. In 2017 nearly 12 million contracts changed hands, roughly double the number in 2016. According to CFFEX, most of the trading in this contract comes from institutions rather than retail investors, a notable contrast to the pattern in other futures markets in China.
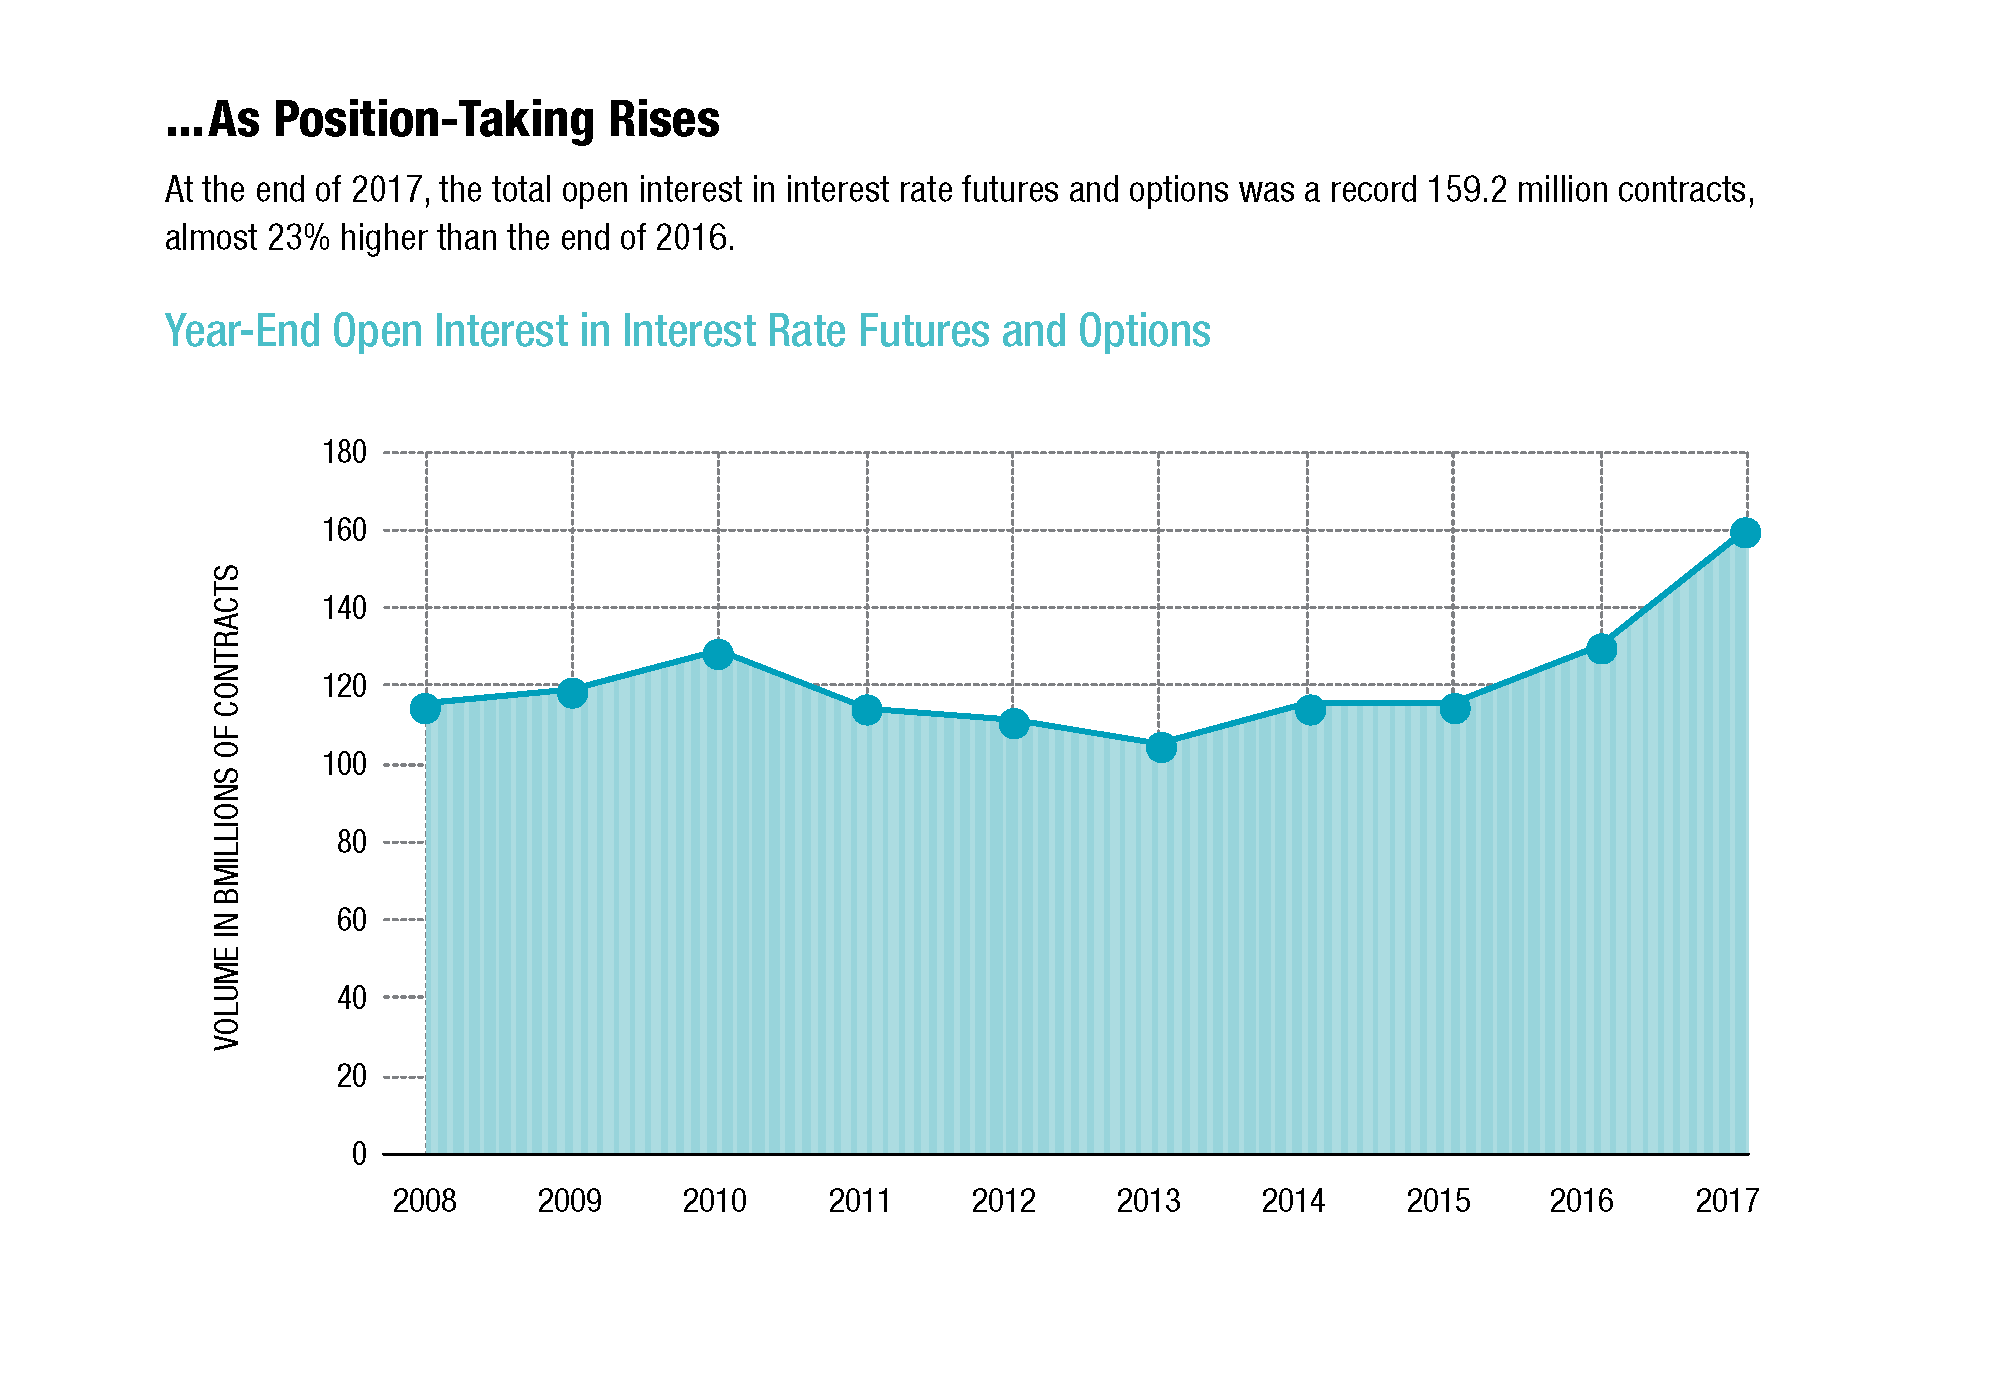
The other dimension of our data is open interest, i.e., the number of contracts outstanding at any one moment in time. We measure open interest at the end of the month, and when comparing one year to another, we use the end-of-December numbers. In effect, open interest measures the depth of the market rather than the amount of trading activity, but it can be used as an indicator of future trading activity. Rising open interest indicates that either the existing market participants are holding larger positions, or new participants are coming into the market, or a mixture of the two.
At the end of 2017, the total open interest in interest rate futures and options was 159.2 million, up 22.8% from the end of 2016 and the highest level this industry has ever seen. Given this upsurge in open interest, it seems very likely that the trading of interest rate futures and options will continue to rise in 2018.
Comparing North America to Asia-Pacific
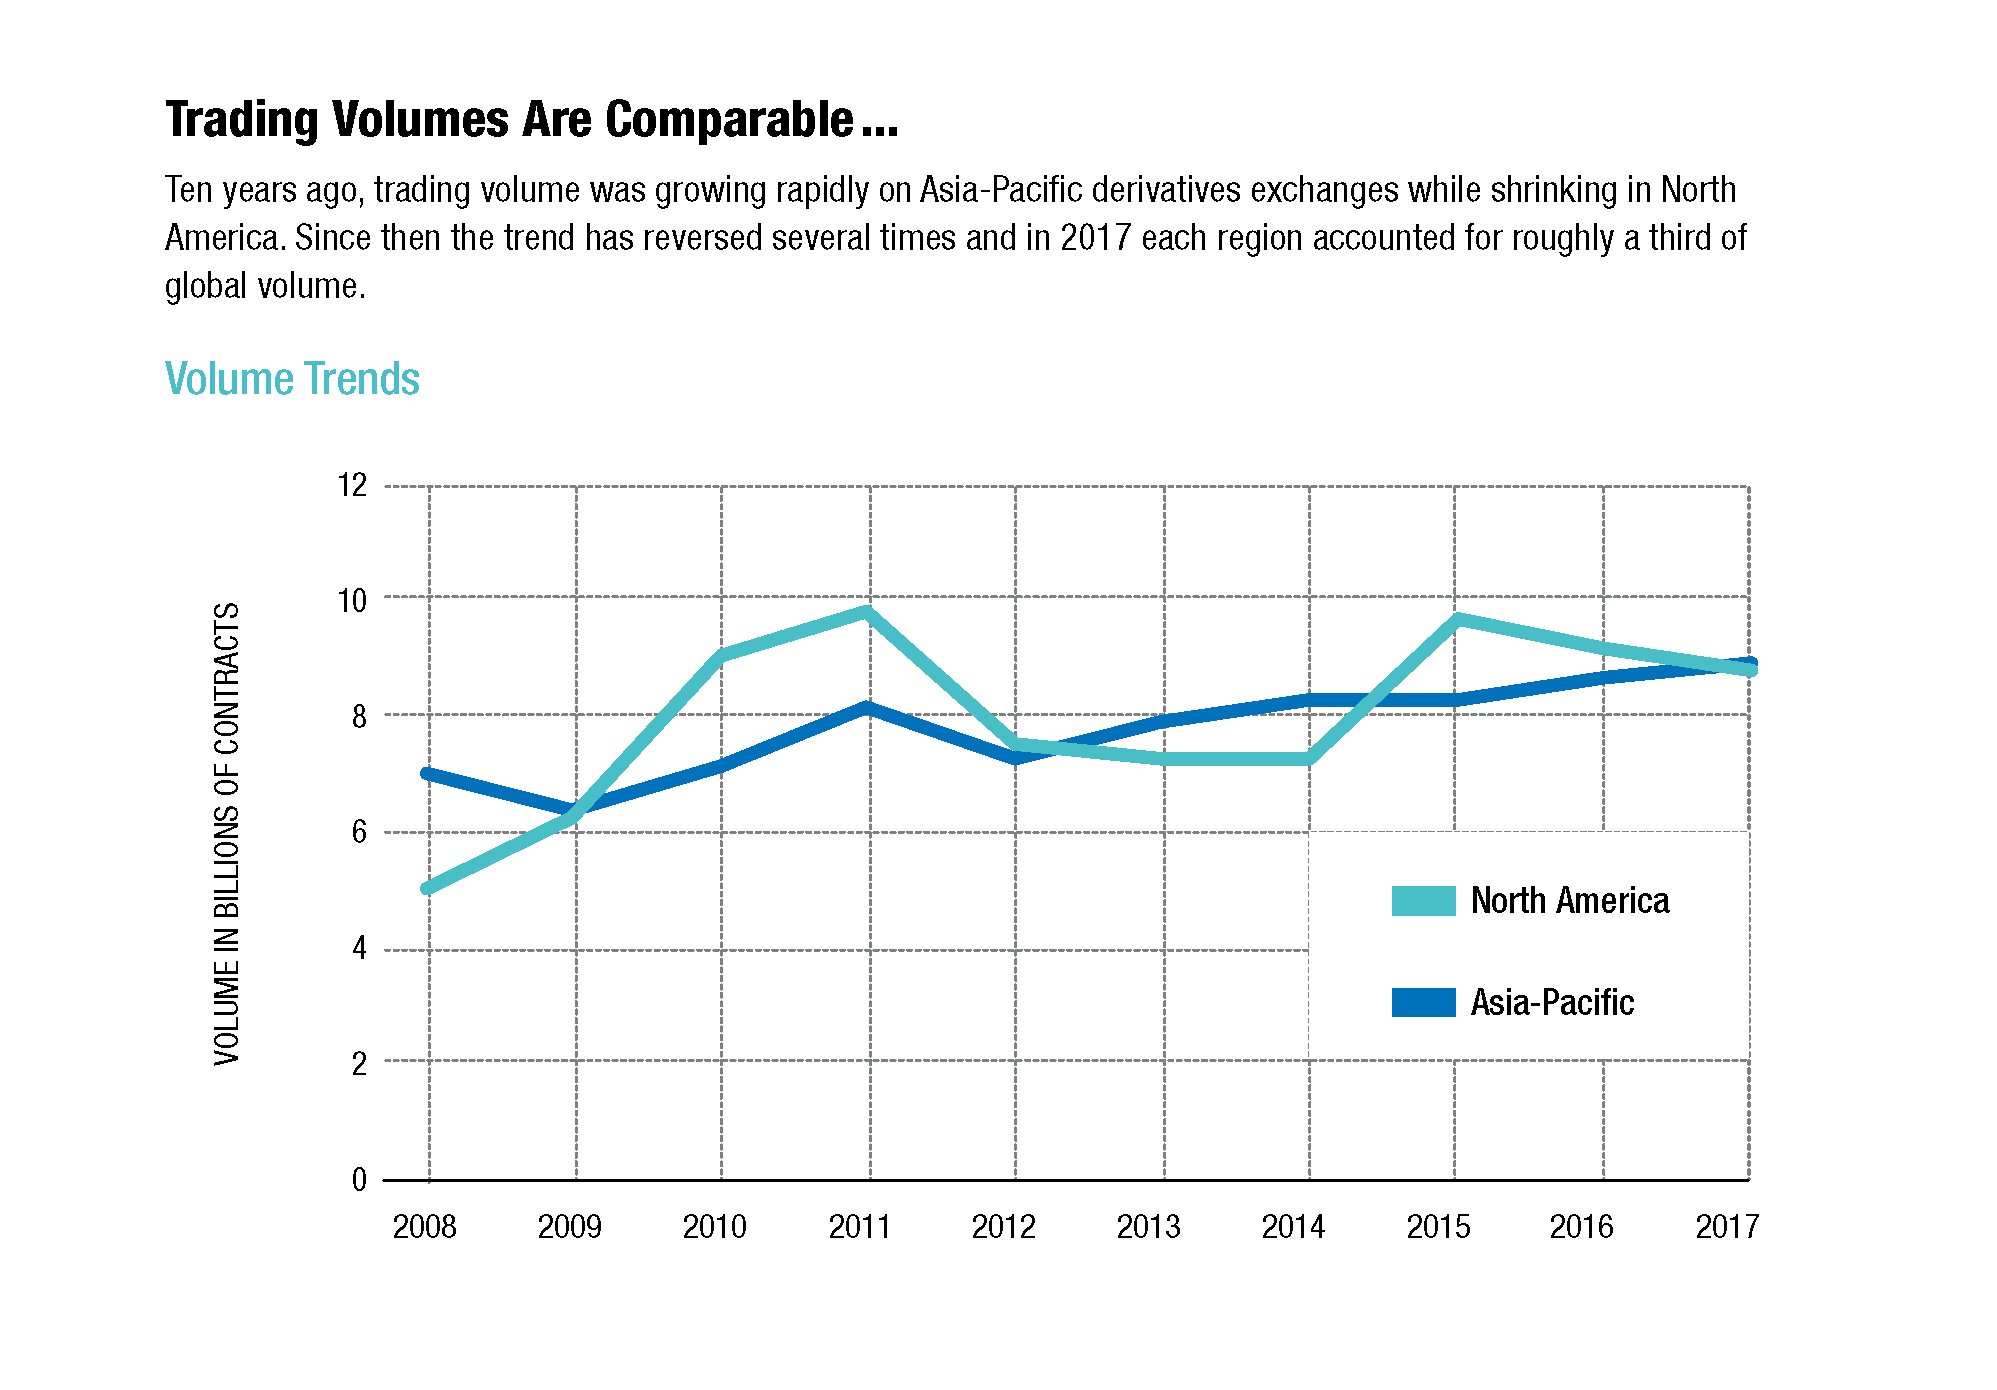
As mentioned in the introduction, one of the big trends in 2017 was the contrast in the fortunes of the two regions that account for the majority of global volume. Trading activity in North America rose while Asia-Pacic declined. In this section we take a closer look at this trend.
Looking at just the last two years, total volume in North America, which consists of exchanges in the U.S. and Canada but not Mexico, rose from 8.59 billion in 2016 to 8.89 billion in 2017. Meanwhile, total volume across Asia-Pacific fell from 9.18 billion in 2016 to 8.81 billion in 2017.
Now let's look at the trend over the last 10 years. During the first part of that decade, Asia-Pacific was growing more rapidly than North America, and in 2010 total volume in that part of the world surpassed North America for the first time. Since then, however, North America has gradually regained the lead. Asia-Pacific volume peaked in 2011, bounced up and down for several years, and then began trending downward in the last two years.
What caused this decline? The main reason was a collapse in volume on China's three commodity futures exchanges. Total volume across these three exchanges fell from 4.12 billion in 2016 to 3.05 billion in 2017, a decline of 1.07 billion contracts or 25.9%.
The slowdown in trading was not universal. In fact, several newly introduced commodity futures grew very quickly in 2017. But the growth in the new contracts did not go far enough to offset very large declines in some of the industry's most active contracts.
For example, the steel rebar futures contract traded on the Shanghai Futures Exchange, which ranks as the most actively traded metal futures contract in the world, saw a 24.8% drop-off in volume in 2017. Soybean meal futures traded on the Dalian Commodity Exchange, the most actively traded agricultural futures contract in the world, plummeted 58.1% in 2017. Rapeseed meal futures, which had been the top contract at the Zhengzhou Commodity Exchange, fell 67.6%.
The decline in Chinese volume reflects an important feature of the domestic market. Much of the trading in China stems from speculative trading by retail investors, which tends to be less steady than institutional trading. Looking back to 2015, that is what drove the explosion of trading in the CSI 300 stock index futures. At one point that year, the CSI 300 futures were the most actively traded stock index futures in the world. That fall, however, the Chinese authorities cracked down on this market, leading to a collapse in volume that persists to this day.
Retail investors also play an outsized role on the Indian exchanges. For example, the Bank Nifty options that trade on the National Stock Exchange of India exploded in popularity in 2017. Total volume in this contract tripled to 800.4 million contracts, making it the most actively traded derivatives contract in the world. One reason for the increase was that NSE introduced weekly options in August 2016, providing more ways for retail investors and proprietary traders to access this market.
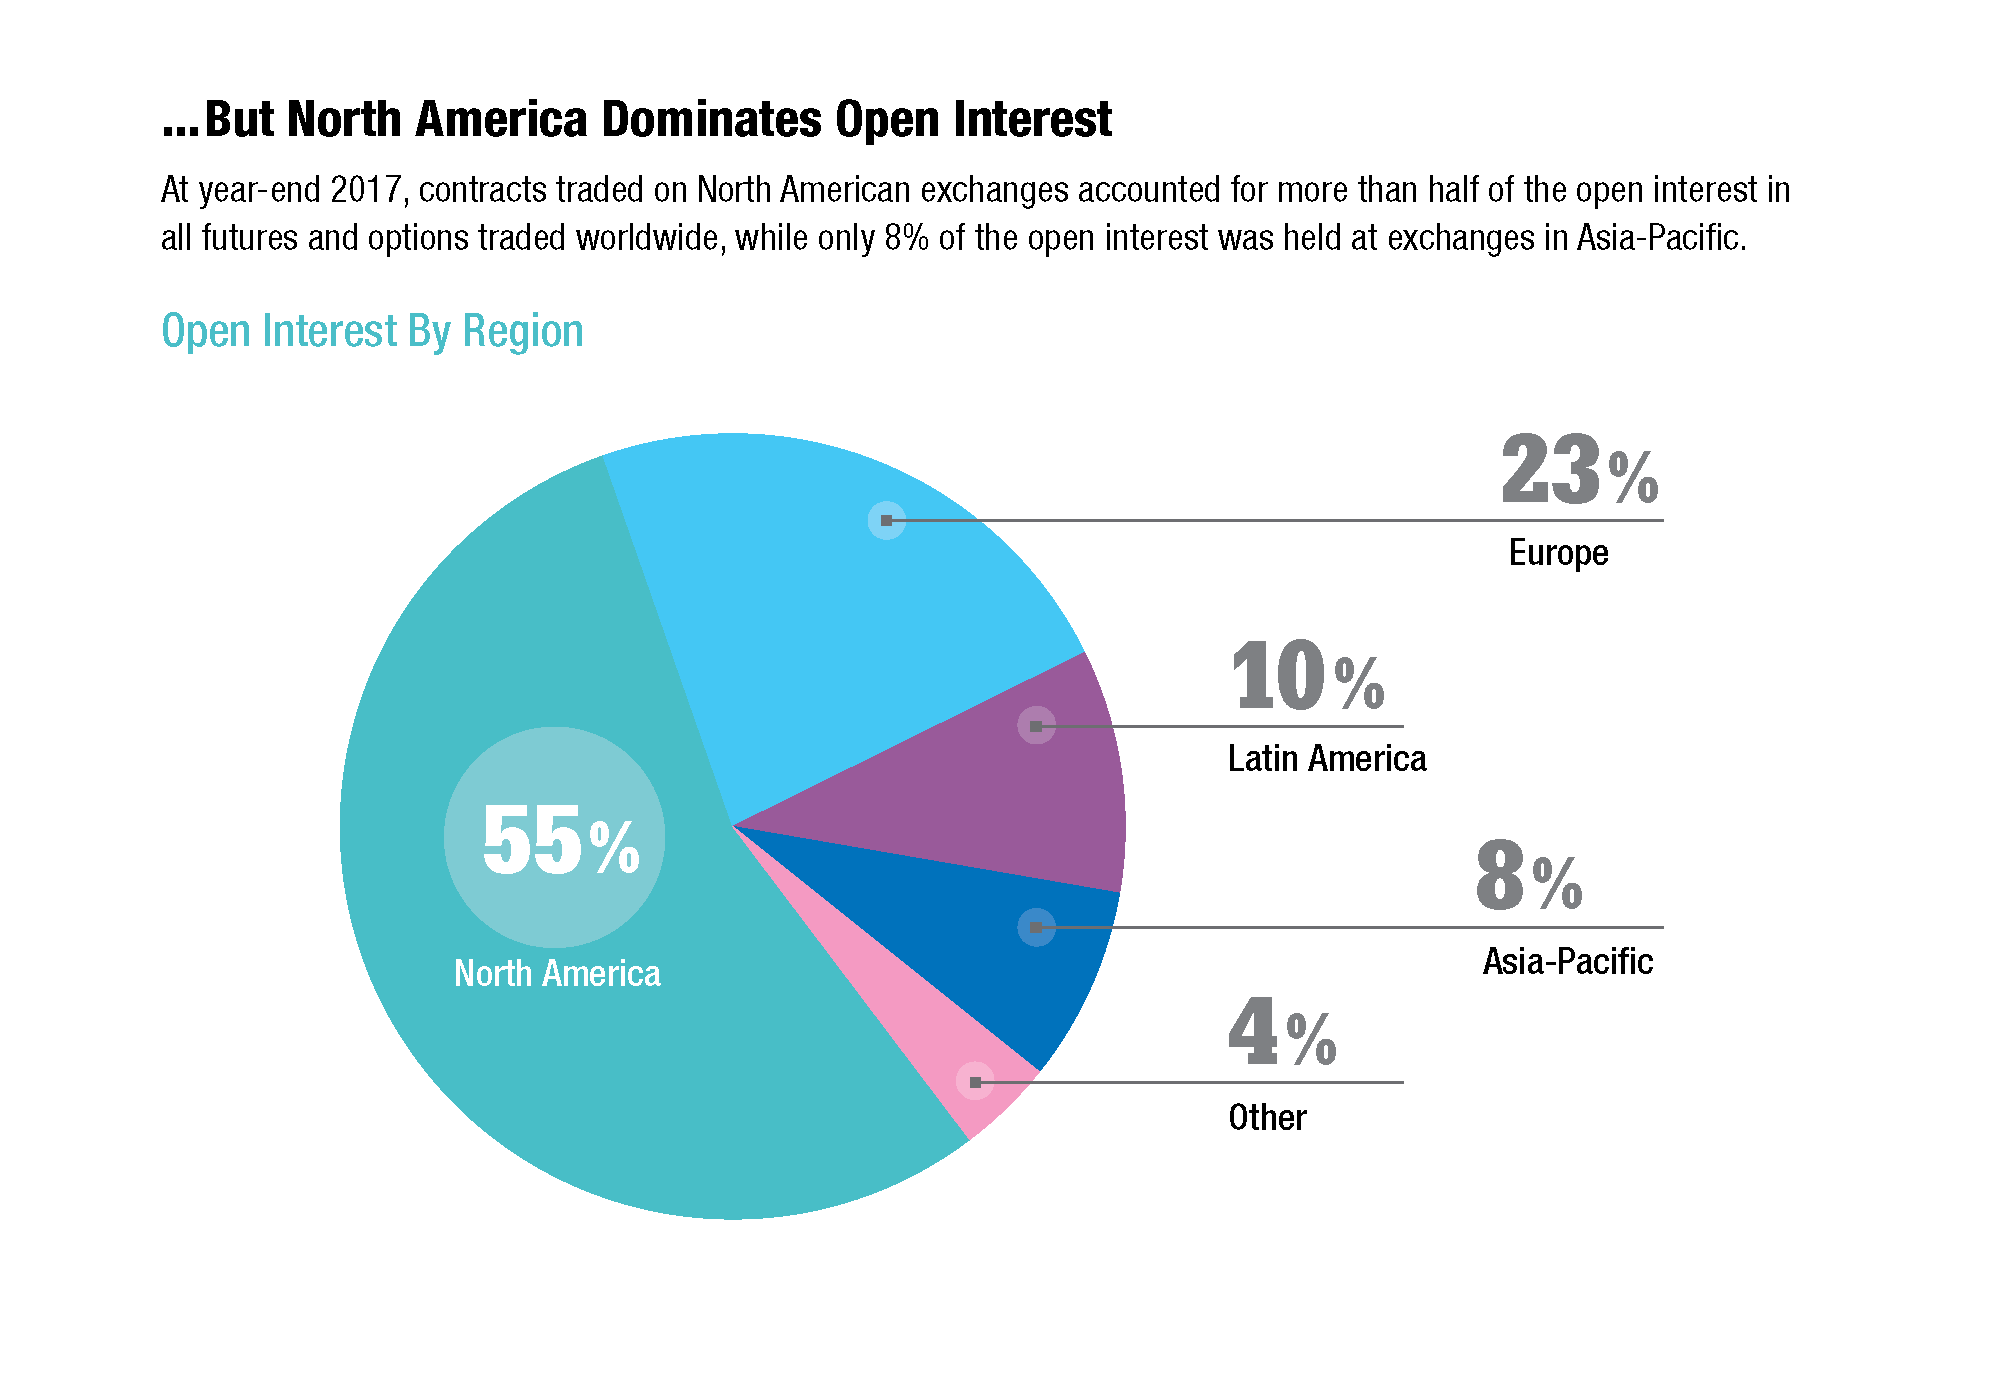
This contrast in market composition helps explain a stark difference in open interest. Asia-Pacific accounts for 34% of global volume but only 8% of the open interest. In other words, exchanges in Asia-Pacific get a higher proportion of their volume from participants trading in and out of positions, and a much lower proportion from long-term position holding. In contrast, North America exchanges have roughly the same amount of volume but a much higher level of open interest. In fact, North America accounted for 55% of the total open interest worldwide at the end of 2017.
It is important not to overstate this contrast. The U.S. equity options market has a large retail component, and there are also many wholesale contracts in Asia. In addition, the level of open interest in Asia is gradually rising. Since 2008, the year-end open interest on exchanges in Asia-Pacific has more than doubled. To put it another way, the ratio of volume to open interest has fallen from 235:1 to 128:1. That is still relatively high compared to other parts of the world, but the trend is in the direction of more long-term position-taking.
As a side note, it is worth noting that changes in contract size affected volume and open interest on the Korea Exchange, one of the region's largest derivatives markets. As mentioned in the introduction, the Korea Exchange's volume rose 46.5% in 2017, thanks to a resurgence of trading in its Kospi 200 index options. This was partly due to a change in the size of the contract in March 2017. The exchange reduced the multiplier from 500,000 won to 250,000 won, in line with an announcement from the Financial Services Commission, the government agency that oversees the exchange.
This was not the first change in the size of this contract. In March 2012, the exchange increased the multiplier from 100,000 won to 500,000 won at the directive of the FSC, which wanted to discourage retail speculation and encourage institutional usage. That five-fold change drastically reduced the volume in the Kospi option, which at that time was the most actively traded derivative contract in the world.