Asia takes the lead
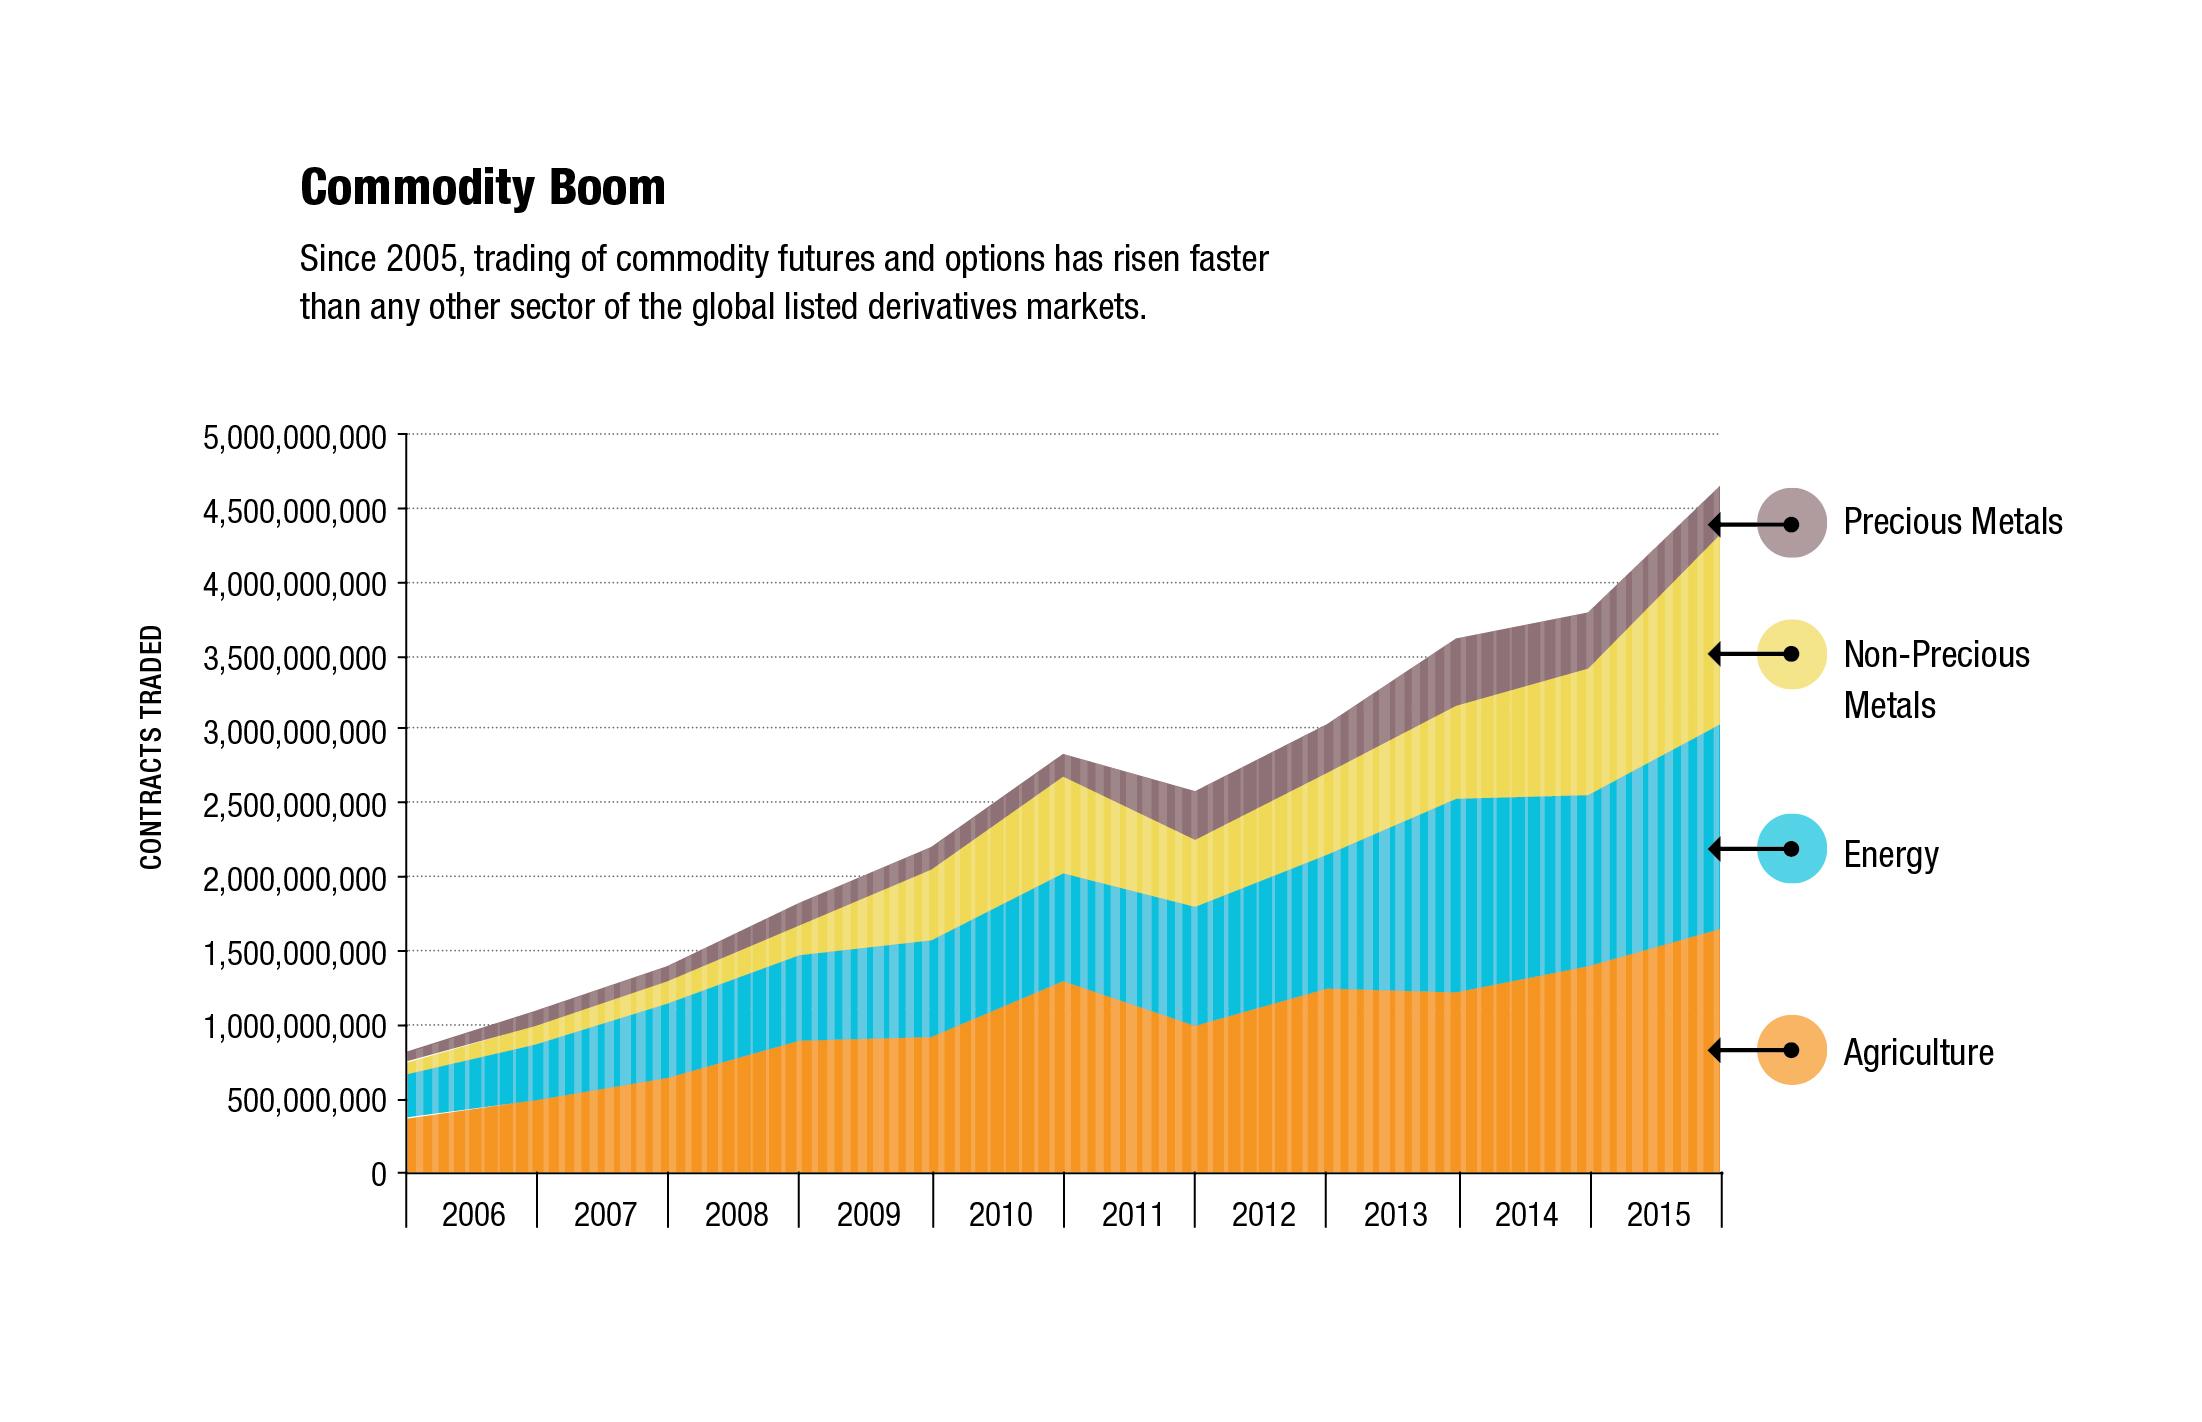
This year’s annual survey of derivatives exchange volumes highlights strong growth in the trading of futures and options at exchanges in China, India, Korea, Singapore and other parts of Asia. Another big theme in 2015 was a surge in the trading of commodity futures and options, which has grown more rapidly over the past several years than any other sector of the global listed derivatives markets.
At the global level, the total number of futures and options traded on exchanges worldwide rose to 24.78 billion contracts in 2015. That was not quite a record, but it was up 13.5% from 2014, giving the industry its highest rate of growth since 2010.
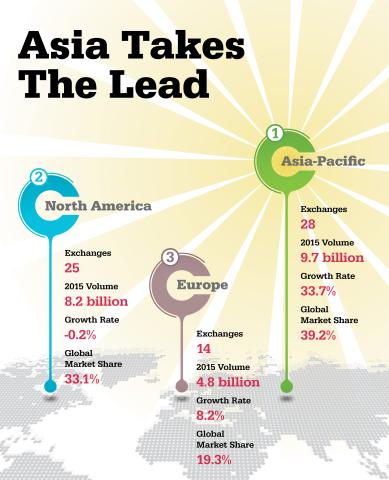
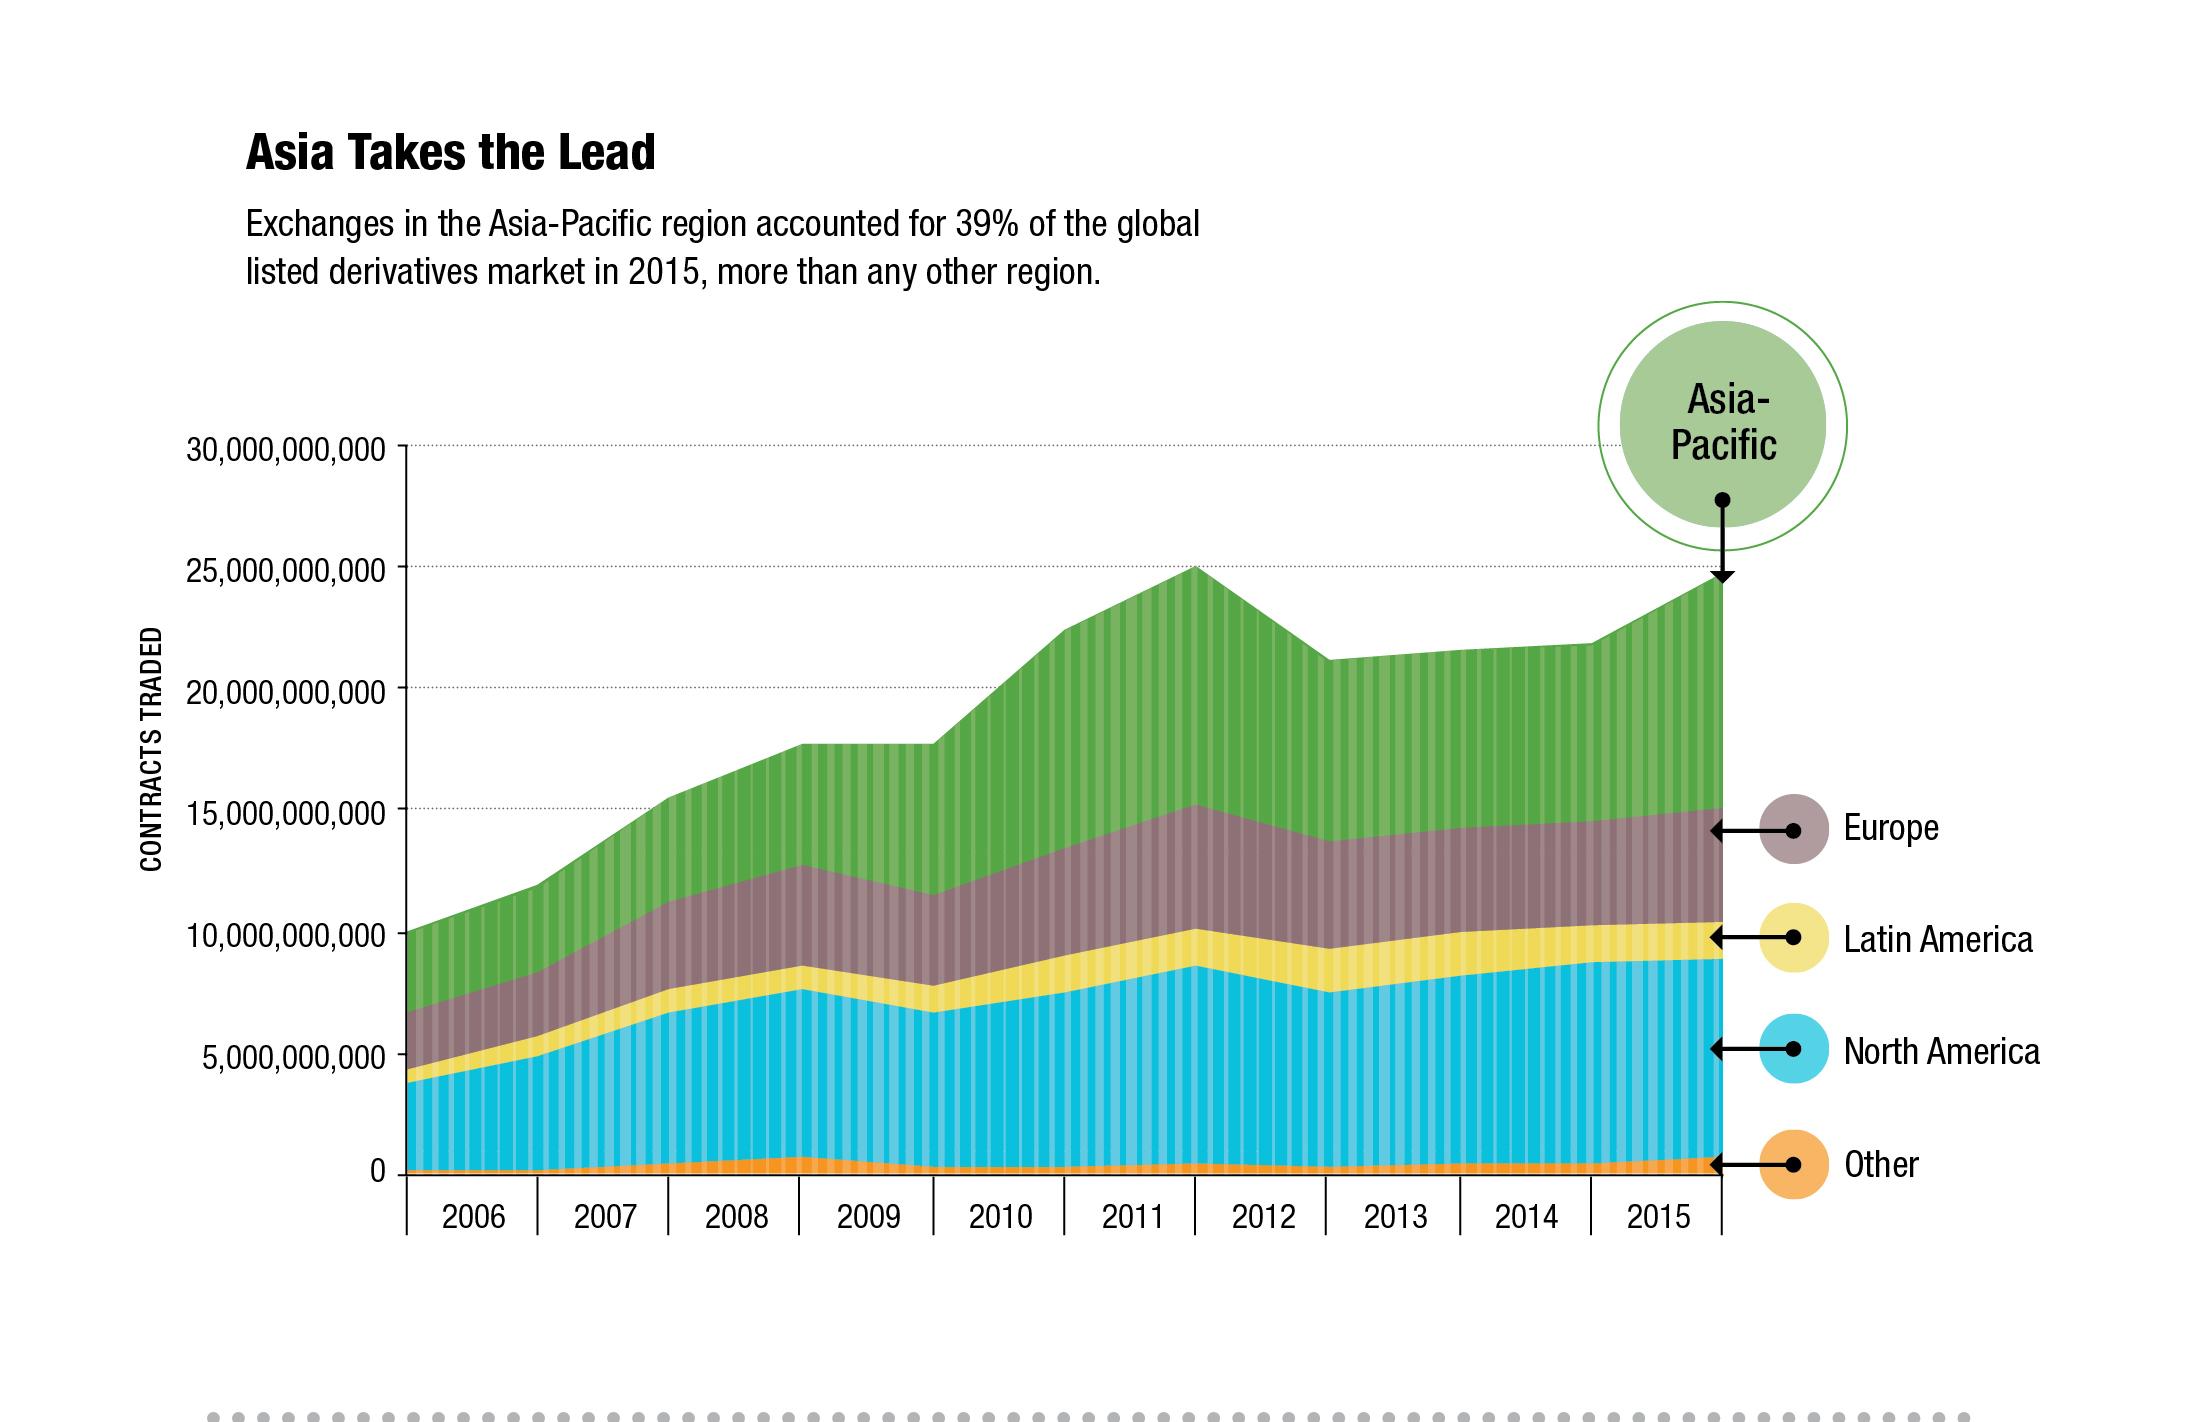
One of the main reasons was a surge in trading activity in Asia. Our two most recent annual volume surveys showed that North America grew faster than the rest of the world in 2013 and 2014, but the pattern shifted in 2015. Total volume on Asia-Pacific exchanges jumped 33.7% to 9.7 billion contracts in 2015, the highest level for that region since 2011.
European exchanges also saw an increase in trading, with volume rising 8.2% to 4.77 billion contracts. In contrast, North America pulled back slightly, with volume declining 0.2% to 8.19 billion contracts. Latin America, the fourth largest region, fell 4.4% to 1.45 billion, the third consecutive year of declining volume. And lastly, the group of countries in the “other” category, which consists of Turkey, Israel, South Africa and Greece, rose 51.9% to 658.1 million contracts.
The shift in the geography of growth meant that Asia-Pacific pulled ahead of North America as a percentage of global trading activity. Exchanges in the Asia-Pacific region accounted for 39% of the worldwide future and options volume, followed by North America with 33% and Europe with 19%. This was not the first time, however, that the Asia-Pacific region ranked number one in our annual volume survey. That breakthrough came in 2010, when a boom in equity index and commodity trading helped lift Asian exchanges at the same time that the after-effects of the financial crisis were weighing on the major exchanges in the U.S. and Europe. That trend reversed in 2012, however. Asian growth went into reverse, North America started to grow again, and North America retook the lead in 2013.
It is important to note that trading volume is just one measure of industry growth. We measure volume by the number of contracts traded, and there are many variations in contract sizes from one exchange to the next. Many of the fastest growing markets in Asia have relatively small contracts and draw much of their business from retail traders, whereas the leading exchanges in North America and Europe tend to have larger size contracts that are better suited to institutional investors, corporate hedgers and other wholesale market participants.
That said, the rising level of activity in Asia-Pacific was spread across a large number of exchanges. Of the 28 derivatives exchanges in the region that were covered in our survey, 18 had double-digit increases in volume in 2015 and only six had a decline. In addition, the growth was spread across a large number of countries, including China, India, Korea, Singapore and Taiwan. Even Japan, which has suffered from falling levels of trading for several years, saw a revival of growth. All four of its derivatives exchanges had double-digit rates of growth in 2015.
This year’s survey is based on data collected from 78 derivatives exchanges. Volume includes futures and options that are traded on-exchange and submitted for clearing as well as contracts traded on- exchange. Geographical location is determined by the jurisdiction in which the exchange is regulated, rather than the location of the parent company.
Record amount of commodity trading
Contracts based on equity indices, currency exchange rates, and commodities were the three categories with the greatest rates of growth in 2015.
The total number of equity index futures and options rose 13.7% to 8.34 billion contracts, nearly reaching the peak of 8.47 billion set in 2011. Some of this growth came from markets where contract sizes are relatively small, such as the National Stock Exchange of India. But there was also growth in wholesale markets dominated by institutional investors, such as the Eurostoxx 50 futures and options traded on Eurex.
Currency contracts jumped 31.2% to 2.78 billion, in sharp contrast to 2014 when volume in this category fell 15%. Here as well much of the growth came from relatively small contracts listed on exchanges in places like India, Russia, Turkey and Argentina, and in most cases the contracts track the local exchange rate versus the U.S. dollar. But there was also healthy growth in wholesale markets such as the Euro FX futures and options listed on the Chicago Mercantile Exchange. Trading of CME’s Euro FX futures volume rose 25.2% to 65.4 million contracts in 2015, and trading in the Euro FX options jumped 62.1% to 12.4 million contracts.
Commodity contracts, which include futures and options based on energy, agriculture, precious metals and non-precious metals, rose 22.6% to 4.6 billion contracts. That was a record amount of trading across these four categories, and on a combined basis commodity futures and options now account for almost 19% of global volume. The upswing in commodity trading was not limited to any one sector. Agricultural volume rose 18.1% to 1.6 billion contracts, energy volume rose 21.2% to 1.4 billion, and non-precious metals volume rose 46.8% to 1.3 billion. All three sectors had record levels of trading activity in 2015. This was also the fourth year of growth in commodity trading, and the ninth year out of 10. There are now more futures and options traded worldwide based on commodities than interest rates, and almost as many as individual equities.
Innovation in Asia
There is another aspect to the commodity story that has been under the radar until recently. In recent years several exchanges have introduced contracts that do not fit into any of our traditional categories, and the amount of trading in some of these “other” contracts is starting to affect the global picture. In 2015 total volume in this “other” category rose to 819.7 million contracts, more than double the amount in 2014. In fact, volume in “other” is more than twice the volume of futures and options on gold, silver and other precious metals.
So what is driving this increase and what are these “other” contracts? At the heart of this trend has been China’s introduction of futures based on industrial commodities. For example, the Zhengzhou Commodity Exchange, which was originally an agricultural futures exchange, branched out into petrochemicals in 2006 by listing futures on pure terephthahlic acid, also known as PTA, which is a chemical used in the production of polyester fabric and other types of plastics. This contract has grown by leaps and bounds, and in 2015 total volume reached 231.6 million contracts, approximately double the level traded in the previous year.
ZCE also offers futures on methanol, which is used as a raw material in the production of other industrial chemicals. Methanol futures were first listed in 2011, but in 2014 the exchange listed a new version of the contract that has grown rapidly in popularity. In 2015 total trading in the new contract jumped to 314.4 million contracts, making it the largest contract in the other category and one of the most actively traded contracts anywhere in the commodity markets.
The Dalian Commodity Exchange is the other big contributor to the other category. Like ZCE, the exchange originally was focused on agricultural products, but the exchange now gets almost half of its volume from other types of commodities such as iron ore. Two of its most actively traded contracts are based on polypropylene, a type of plastic that is used for making carpets, auto parts, food containers and a wide range of other products. Volume in DCE’s PP polypropylene contract reached 107.5 million contracts in 2015, up 333.9% from 2014, and volume in its LLDPE contract reached 119.9 million, up 169.4% from the previous year.
We have to wait and see how these contracts develop over time. Trading volumes in China have a tendency to fall just as dramatically as they rise. But the rise of these four contracts signals the convergence of two broader trends that are likely to lead to further growth in the years ahead.
First, the Chinese authorities have become more willing to allow their exchanges to introduce new futures contracts. Recent years have seen the introduction of futures on not only the plastics mentioned above but also construction materials such as glass, fibre board and block board (also known as plywood) as well as additional agricultural, metals and energy contracts.
Second, the development of China’s industrial sector has created demand for new types of futures contracts. China is the third largest producer of chemicals and petrochemicals in the world and one of the largest consumers of these commodities, which has resulted in more cash-market trading in key raw materials such as methanol. That trend, combined with volatility in prices for all products linked to crude oil, has stimulated growth in the related futures contracts.
Pockets of growth in rate futures
One sector that did not share in the global upswing in trading volumes is the interest rate sector. Total trading of interest rate futures and options was 3.25 billion in 2015, about the same as the previous year and 13% below the peak of 3.74 billion set in 2007, the last year before the financial crisis.
But this flat rate of growth masked several areas where specific contracts saw a notable increase in trading activity. First, the prospect of an increase in the federal funds rate created uncertainty in the markets and prompted market participants to position themselves for the increase, which ultimately took place in December. That directly impacted the Fed Funds futures contract traded at CME Group’s Chicago Board of Trade. Volume in this contract jumped 156% to 20.2 million contracts in 2015, a record amount of trading. The prospect of Fed action also prompted a surge in the trading of options on Eurodollar futures. Total volume in all Eurodollar options, including serials, quarterlies and mid-curves, rose 12.5% to 243.7 million contracts, the highest since 2007.
CME also saw continuing growth in the ultra version of its Treasury bond futures. This contract, which was introduced in 2009, tracks Treasury bonds with at least 25 years of remaining term to maturity. In effect, it adds another tool for managing long-term interest rate risk and adding duration to interest rate portfolios. Last year volume in this contract reached 29.1 million, a record amount and up 14.6% from the previous year. According to CME, this now ranks as the fastest growing product in the history of the exchange. Some of its volume may have come from the regular Treasury bond futures, however. Volume in that contract fell 22.8% to 71.9 million.
Meanwhile in Europe, Eurex is having some success in its efforts to diversify its bond complex by adding futures on Italian and French government bonds. These contracts give traders and hedgers more ways to manage exposures to European interest rates, and reflect the fact that Europe’s sovereign bond markets have diverged to such a degree that benchmarks based on German debt are not as effective as they used to be.
Trading in the Long-Term BTP contract, which Eurex introduced in 2009, rose 47.2% to 25.5 million contracts in 2015. Trading in the Short-Term BTP contact, introduced in 2010, jumped 50.7% to 5.58 million. And trading in the OAT futures contract, which was launched in 2012, rose 24.1% to 21.6 million contracts. These volumes are still just a fraction of the trading in the exchange’s flagship Bund, Bobl and Schatz contracts, but they are growing at a much faster rate.
Exchange rankings
Even with contract innovation and growth, many of the top exchanges had a difficult year in 2015. CME Group’s overall volume edged up 2.6%, and most of that growth came from an 18.2% jump in the number of energy products traded at the New York Mercantile Exchange. Eurex was boosted by a 12.2% increase in volume in its European markets, but a decline in its U.S. equity options business reduced the overall growth rate to 8.3%.
Intercontinental Exchange’s volume fell 9.8% in 2015, weighed down by declines in the Liffe interest rate franchise and the Amex and Arca equity options businesses that it acquired from NYSE Euronext. CBOE Holdings and Nasdaq both suffered from declining volume at their U.S. equity options exchanges. CBOE’s volume was down 11.4%, and Nasdaq’s volume was down 8.9%.
In contrast, several exchanges in Asia had explosive growth. All three Chinese commodity exchanges grew by double-digit rates and now rank among the 10 largest exchanges in the world. The biggest growth story was the National Stock Exchange of India. Its volume grew 61.2% to 3.03 billion contracts, second only to CME Group in our exchange ranking.
More than half of NSE’s volume in 2015 came from options based on the CNX Nifty 50 index, a benchmark for the Indian stock market. Trading in this contract exploded in 2015, rising 81.5% to 1.77 billion. This contract now ranks as the world’s most actively traded listed derivative. It is a relatively small contract, however. Comparisons with other equity index contracts are difficult because contract sizes fluctuate with the value of the underlying indices, but over the course of 2015 it was worth roughly one tenth of the E-mini S&P 500 futures traded at CME.
The Taiwan Futures Exchange and the Singapore Exchange also had very good years, up 30.7% and 52.7% respectively. Taifex rose on the back of increased trading of its futures and options based on domestic stocks and stock indices. In the case of SGX, the main driver was its FTSE China A50 index futures, which has emerged as a way for international investors to manage their exposures to the Chinese stock market. Trading in this contract more than doubled to 95.8 million, making it the exchange’s most actively traded contract in 2015. The other big contributor to SGX’s volume was its iron ore futures and options contracts. Volume in these two contracts more than doubled to a combined 7.33 million. These contracts also have a link to China, in that the price is based on delivery of iron ore to China where it is used in the production of steel.