The swap market entered a new phase in February 2014 with the implementation in the U.S. of the trading requirements established by the Dodd-Frank Act. Under these requirements, trades in certain types of interest rate and credit default swaps must be executed on so-called “SEFs,” short for Swap Execution Facilities. These marketplaces are intended to function largely like exchanges and achieve the post-crisis goal of greater transparency in swaps trading.
While these new trading venues are still in the early stages of development, the information they are disclosing provides an unprecedented window into the larger changes overtaking the swaps market. Under rules established by the Commodity Futures Trading Commission, SEFs are required to publish detailed information every day about their trading volumes and prices. This provides a new opportunity to analyze trading patterns in the swap markets and the evolution of these new trading venues.
In April, FIA published the first issue of SEF Tracker, a periodic report that taps into this newly available information. SEF Tracker provides data on notional volumes across three asset classes—interest rates, credit and foreign exchange—collected directly from more than a dozen venues. The report is published on the FIA website and is designed to shed light on the level and composition of SEF trading activity. Even though the data only covers a few months of trading, we can already see significant fluctuations in volume and market share from week to week.
There are several other new sources of data on the swaps market. These include repositories, called swap data repositories in the U.S. and trade repositories in the EU and elsewhere. In addition, ISDA’s swapsinfo.com, Tradeweb’s InSite and ClarusFT are compiling and synthesizing information from these new sources, and the CFTC is using data provided by repositories to publish a weekly report on trading volume and notional outstanding.
This new array of information about the swaps marketplace is important for market participants as they evaluate competing venues and levels of liquidity in an evolving marketplace. It is also important for SEFs themselves as they benchmark themselves against their competition, for regulators as they seek to analyze systemic risk and assess the development of the new swaps landscape, for investors in public companies with SEF entities, and for all observers of market structure.
There are some obstacles to using this data effectively, however. In creating SEF Tracker, it became clear to FIA that more work could be done to harmonize data formats across the SEFs. This would promote consistent quality in the underlying data available for analysis. Second, there are wide variations in how instruments are described, which makes it difficult to compare activity across SEFs at a granular level. Third, the data currently being made public give us only a partial picture of market structure, as explained in more detail later.
Methodology
To build SEF Tracker, FIA faced a choice between collecting data from trading venues or relying on swap data repositories. The advantage of relying on SDRs is that they collect a great deal of in- formation about individual trades and can provide useful insights on both volume and risk. However, no single SDR captures 100% of SEF trades, and there is no public mechanism for reconciling SEF trades across SDRs.
FIA therefore opted to obtain the data directly from the SEFs. This provides a complete data set of all SEF trades and identifies which SEF each trade took place on. In addition, going to each trading venue directly is consistent with established FIA method- ology in aggregating futures and options data from over 80 ex- changes worldwide.
Data reconciliation is a major challenge, however, given the number of SEFs and the variations in how they meet their report- ing requirements. FIA therefore engaged directly with the report- ing SEFs to ensure that it is correctly interpreting the conventions and descriptions used in their respective reports.
The interest rate swaps market is especially challenging because of the very large range of product types – basis swaps, overnight index swaps, forward rate agreements, zero coupon swaps, vari- able notional swaps, cross-currency swaps, swaptions and so on. In addition, the lack of standardization in how products are de- scribed in the SEF reports directly challenges production of a clean consistent data set.
Instrument descriptions range from simple and straightforward to the intricate and opaque. Some SEFs put the currency of the contract at the beginning of the description; others put the type of contract at the beginning. Some explicitly state the maturity; others instead include the start and end dates.
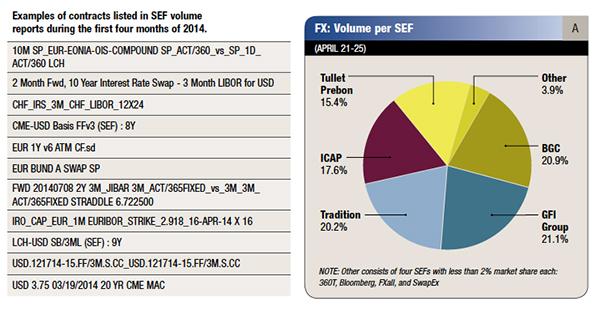
As the following table shows, a firm grasp of trading desk jargon is necessary to understand the descriptions SEF use in their reporting of the various types of interest rate products traded on their venues.
Incidentally the SEF Tracker actually tracks more than just SEFs; it also covers swaps traded on venues that have opted to register as designated contract markets, so the name SEF Tracker is a bit of a misnomer.
Volume trends and market share
Looking at the data from the most recently available SEF Tracker, which covers January to April 2014, it is easy to spot several broad trends:
- SEF volume peaked in January and then hit a low in mid-February when the CFTC’s trade execution mandate came into effect. Since then SEF volume has risen somewhat but has not yet rebounded to the level seen in January.
- IRS is by far the largest asset class by notional volume. Roughly half of IRS volume is in forward rate agreements (FRAs).
- CDS volumes increased significantly after the CDS trading mandate commenced in late February but have since come back down. The vast majority of CDS trading on SEFs is in the products subject to the CFTC’s trading mandate.
- FX volumes have been reasonably consistent both before and after February, and notional volumes are split roughly 50-50 between options and non-deliverable forwards.
The market share picture is mixed. One platform—Bloomberg— dominates CDS, with roughly 70% of the SEF CDS volume. In IRS and FX, however, the market is more fragmented. SEF Tracker data for April showed at least five platforms with sizeable market share in both IRS and FX. The competitiveness in FX is illustrated by Chart A.
It is also apparent that SEFs affiliated with incumbent platforms have emerged with most of the volume, while those built by newcomers have thus far captured very little.
Chart B shows IRS volume trends peaking in January and then declining when the MAT SEF trading requirement started. It also shows strong performance by the SEFs operated by interdealer brokers. Chart C, which displays relative market share as a percentage that always adds up to 100%, shows that dealer-tocustomer platforms affiliated with Bloomberg and Tradeweb have been growing since the February MAT trading inception.
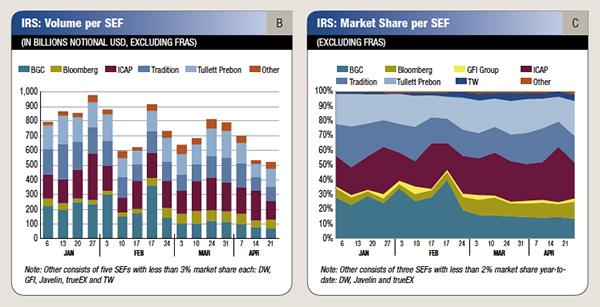
When analyzing market share in the interest rate market, it is helpful to look at volumes both including and excluding FRAs. FRA notionals are so enormous that they dwarf activity in other IRS products, making it more difficult to spot patterns when FRAs are included. FRAs typically have a very high notional value and a very short maturity, and the amount of risk they represent is generally much lower than, say, a typical 10-year interest rate swap. In addition, the vast majority of FRA volume on SEFs comes from facilities operated by ICAP and Tullett Prebon. Excluding FRAs therefore provides a more nuanced representation of the competition among SEFs in the rest of the IRS market.
Market structure—known unknowns
One fascinating development is that it is now possible to zero in on two distinct regulatory drivers of SEF trading. To appreciate this, it’s worth recapping how the SEF rules and core principles work.
Any type of swap that is deemed “Made Available to Trade” (often referred to as MAT) must be traded on a SEF or DCM. A swap type qualifies as MAT if it is subject to mandatory clearing and the CFTC has approved a MAT determination submitted by a SEF. Trades in MAT swaps must not only be traded on-SEF, they are subject to SEF execution protocols. MAT trades are also referred to as “Required Transactions.”
The second driver is footnote 88 of the CFTC’s final rule that governs SEFs (the SEF Core Principles). This requires a trading venue to register as a SEF if it operates in a manner that meets the SEF definition, even if the swaps it offers are not subject to the trade execution mandate. In essence, this means that venues conducting trading in a many-to-many manner have to register as a SEF if any of their customers are subject to the CFTC’s authority. Trades in these swaps are referred to as “Permitted Transactions.”
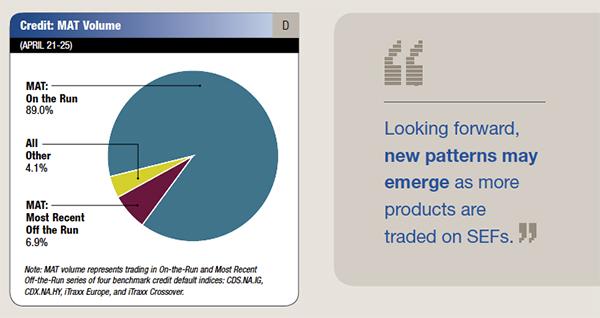
In credit, virtually all of the trading on SEFs is in the handful of CDS index products that are covered by the MAT determinations, as Chart D clearly shows. In contrast, a sizeable amount of the volume in interest rates is in non-MAT products, notably all FRA volume, which accounts for over 50% of IRS notionals. Furthermore, none of the FX volume is in MAT products; no FX products have been made subject to the MAT trading requirements to date.
Thus, over 50% of SEF notional volumes in 2014 to date are in “Permitted Transactions” rather than in “Required Transactions.” Therefore it is not surprising that SEFs affiliated with interdealer brokers are dominating volumes in “Permitted Transactions,” as their markets are characteristically many-to-many.
There is a further wrinkle. The fact that a swap was “on-SEF” does not tell us much about how the trade was executed. This is because Permitted Transactions can be traded under protocols that are not allowed for Required Transactions. In practical terms, this means that more than 50% of 2014 SEF trades may have been traded under protocols that would not be permitted for MAT trades: some trades continue to be executed through traditional voice-brokered bilateral negotiation; others are traded through request-for-quote protocols and still others through fully automated order book trading.
A further complication is that most SEFs offer more than one trading protocol. Since SEFs generally do not include a field indicating which protocol was used, we cannot rely on this data to compare one trading protocol to another. In fact, we cannot even discern how much SEF trading is conducted electronically.
While SEFs report data on trading volumes, they do not break out trades by counterparty type. For that reason, it is difficult to discern whether the market is migrating away from the traditional separation between dealer-to-dealer and dealer-to-client markets towards an “all-to-all” market.
Another significant omission from the data is trade count. Although a small number of SEFs do provide this in their daily reports, most only offer notional values. This makes it difficult to determine whether transaction throughput is increasing or decreasing, and whether average transaction sizes are growing, remaining the same, or dwindling.
On the horizon
Looking forward, new patterns may emerge as more products are traded on SEFs. For example, over the coming months “package trades”, i.e. multi-legged trades where at least one leg is a SEFmandated swap, will have to be traded on-SEF. Many observers expect a dramatic impact on total SEF volumes, the composition of SEF volumes and relative SEF market share.
We are also likely to see changes in SEF trading activity as the CFTC extends the trade execution mandate further, and as SEFlike platforms in other jurisdictions enter the mix. For example, ICAP recently launched the first trading venue that is registered as a SEF in the U.S. and also as a multilateral trading facility in the U.K. CFTC officials recently have indicated that work is nearly finished on a proposal to mandate clearing for non-deliverable forwards, which would pave the way for transition trades in non-deliverable forwards from “Permitted” to “Required” Transactions. It is also noteworthy that the list of SEFs continues to change as new companies complete the registration process with the CFTC.
Over time, it will be useful to compare SEF activity with activity in off-SEF OTC derivatives markets, which ISDA has been doing, and perhaps in swap futures and other listed derivatives markets as well.
Conclusions and recommendations
It would be useful to the market if all SEFs were to include certain fields in their reports, such as trade count, MAT indicator and block indicator. It would also be helpful to see greater consistency and standardization of descriptions and instrument classifications across SEFs. But given the competition and resource constraints among SEFs, it is difficult to predict when these improvements may emerge.
What can we expect going forward? It is worth remembering that these are still early days. SEF requirements are broadening and will include new types of swaps—the CFTC’s package swap timetable alone stretches into the fourth quarter of 2014. The regulatory landscape is still evolving in the U.S., Europe and elsewhere, and swap dealers are undertaking significant changes to their business models in response to new capital requirements under Basel III. All of these will influence the evolution of swaps trading. Operational issues are still being ironed out, the market infrastructure is still in flux, electronic trading of swaps is in its infancy, and smart order routing is perhaps just beginning as well.
It is therefore advisable to take the early results with more than a grain of salt. Data is elusive; it resists interpretation; the more you engage with it the less well-behaved it can be. No single source of data available to the public has all the answers, so market participants and the public will be best served looking across multiple sources, at least for now.
Jeff Bandman is an advisor to FIA for the SEF Tracker initiative. His consultancy, Indian Wells Group, provides advisory services regarding market structure in OTC derivatives and other businesses. He was previously head of partnerships and alliances for LCH.Clearnet’s SwapClear service. Prior to that he had leadership roles in numerous market structure initiatives, including LiquidityHub, Project Rainbow and rebuilding Cantor Market Data.