Several years ago a group of buy-side firms came together in an effort to lead the interest rate swap market towards greater standardization of contract terms. They developed a template for a standardized contract with pre-defined, market agreed terms. Their hope was that this new contract, called the Market Agreed Coupon contract, would lead to greater liquidity, transparency and operational efficiency.
Market practices are hard to change, however, and MAC swaps are still a small part of the overall interest rate swap market. Even within the limited market for dealer-to-customer trading, trades involving MAC swaps are around 10% of overall customer trading. On the other hand, demand appears to be slowly picking up. In 2015, more than 15,400 MAC trades were executed on swap execution facilities with over $1 trillion of notional value. That compares with $610 billion notional in MACs traded in 2014.
In this article, Orlando Almodovar, an analyst at a firm that tracks swap market data, takes a close look at several trends in MAC trading. Using publicly available data from swap execution facilities and swap data repositories, he finds that the market in 2015 was highly concentrated on two SEFs, Tradeweb and Bloomberg. He also finds that nearly all MAC trading was in U.S. dollar-denominated contracts, but trading in MACs denominated in Euros and pounds sterling began to pick up during the second half of 2015. He also looks at the distribution of trades across maturities and the types of trading strategies that were used the most often.
The advent of swap execution facilities and swap data repositories has greatly increased the amount of information available on the interest rate swap market in the U.S. It is now possible to analyze publicly available data on swap trading and measure total activity, compare trading venues and identify patterns of trading activity.
This new level of transparency is especially helpful in understanding the development of the MAC swap market. These contracts are well suited for trading on swap execution facilities and have the potential to become an efficient way for market participants to reduce the notional amounts outstanding in their portfolios.
The data for MAC trading are quite fragmented, however. To measure both the number of trades and the value of trades requires combining daily transactional data in files published by multiple SEFs with more detailed data published by swap data repositories. Once both sets are combined, it becomes possible to get a more complete picture of MAC trading.
During 2015, dollar-denominated MAC swaps accounted for almost 95% of all MAC trading on SEFs. Trading in Euro and pound sterling-denominated MAC swaps began picking up in August and reached $12.9 billion in December.
Where do MAC swaps trade?
The majority of dollar-denominated MAC trading on SEFs took place on three venues that target dealer-to-customer trading. Measured by notional value traded, Tradeweb was the leader with over $514 billion transacted in 2015 versus $335 billion in 2014. Bloomberg was next with $431 billion ($270 billion in 2014) and then trueEX with $14 billion. Average daily trading in 2015 was $2 billion for Tradeweb, $1.7 billion for Bloomberg and $270 million on trueEX. It should be noted that there was a very small amount of trading on two other SEFs. GFI executed one MAC in January and Javelin executed a few MACs in April.
Measured by notional value, MAC swap trading accounted for about 5% of the overall amount of SEF volume in dollar-denominated fixed-to-floating swaps, which is the segment of the swap market that is the most similar to MAC swaps. But the ratio was significantly higher on the two SEFs where MAC trading is concentrated. Measured by notional value, MAC swaps accounted for 10.3% of total IRS fixed-float trading on Tradeweb and 6.8% of total IRS fixed-float trading on Bloomberg.
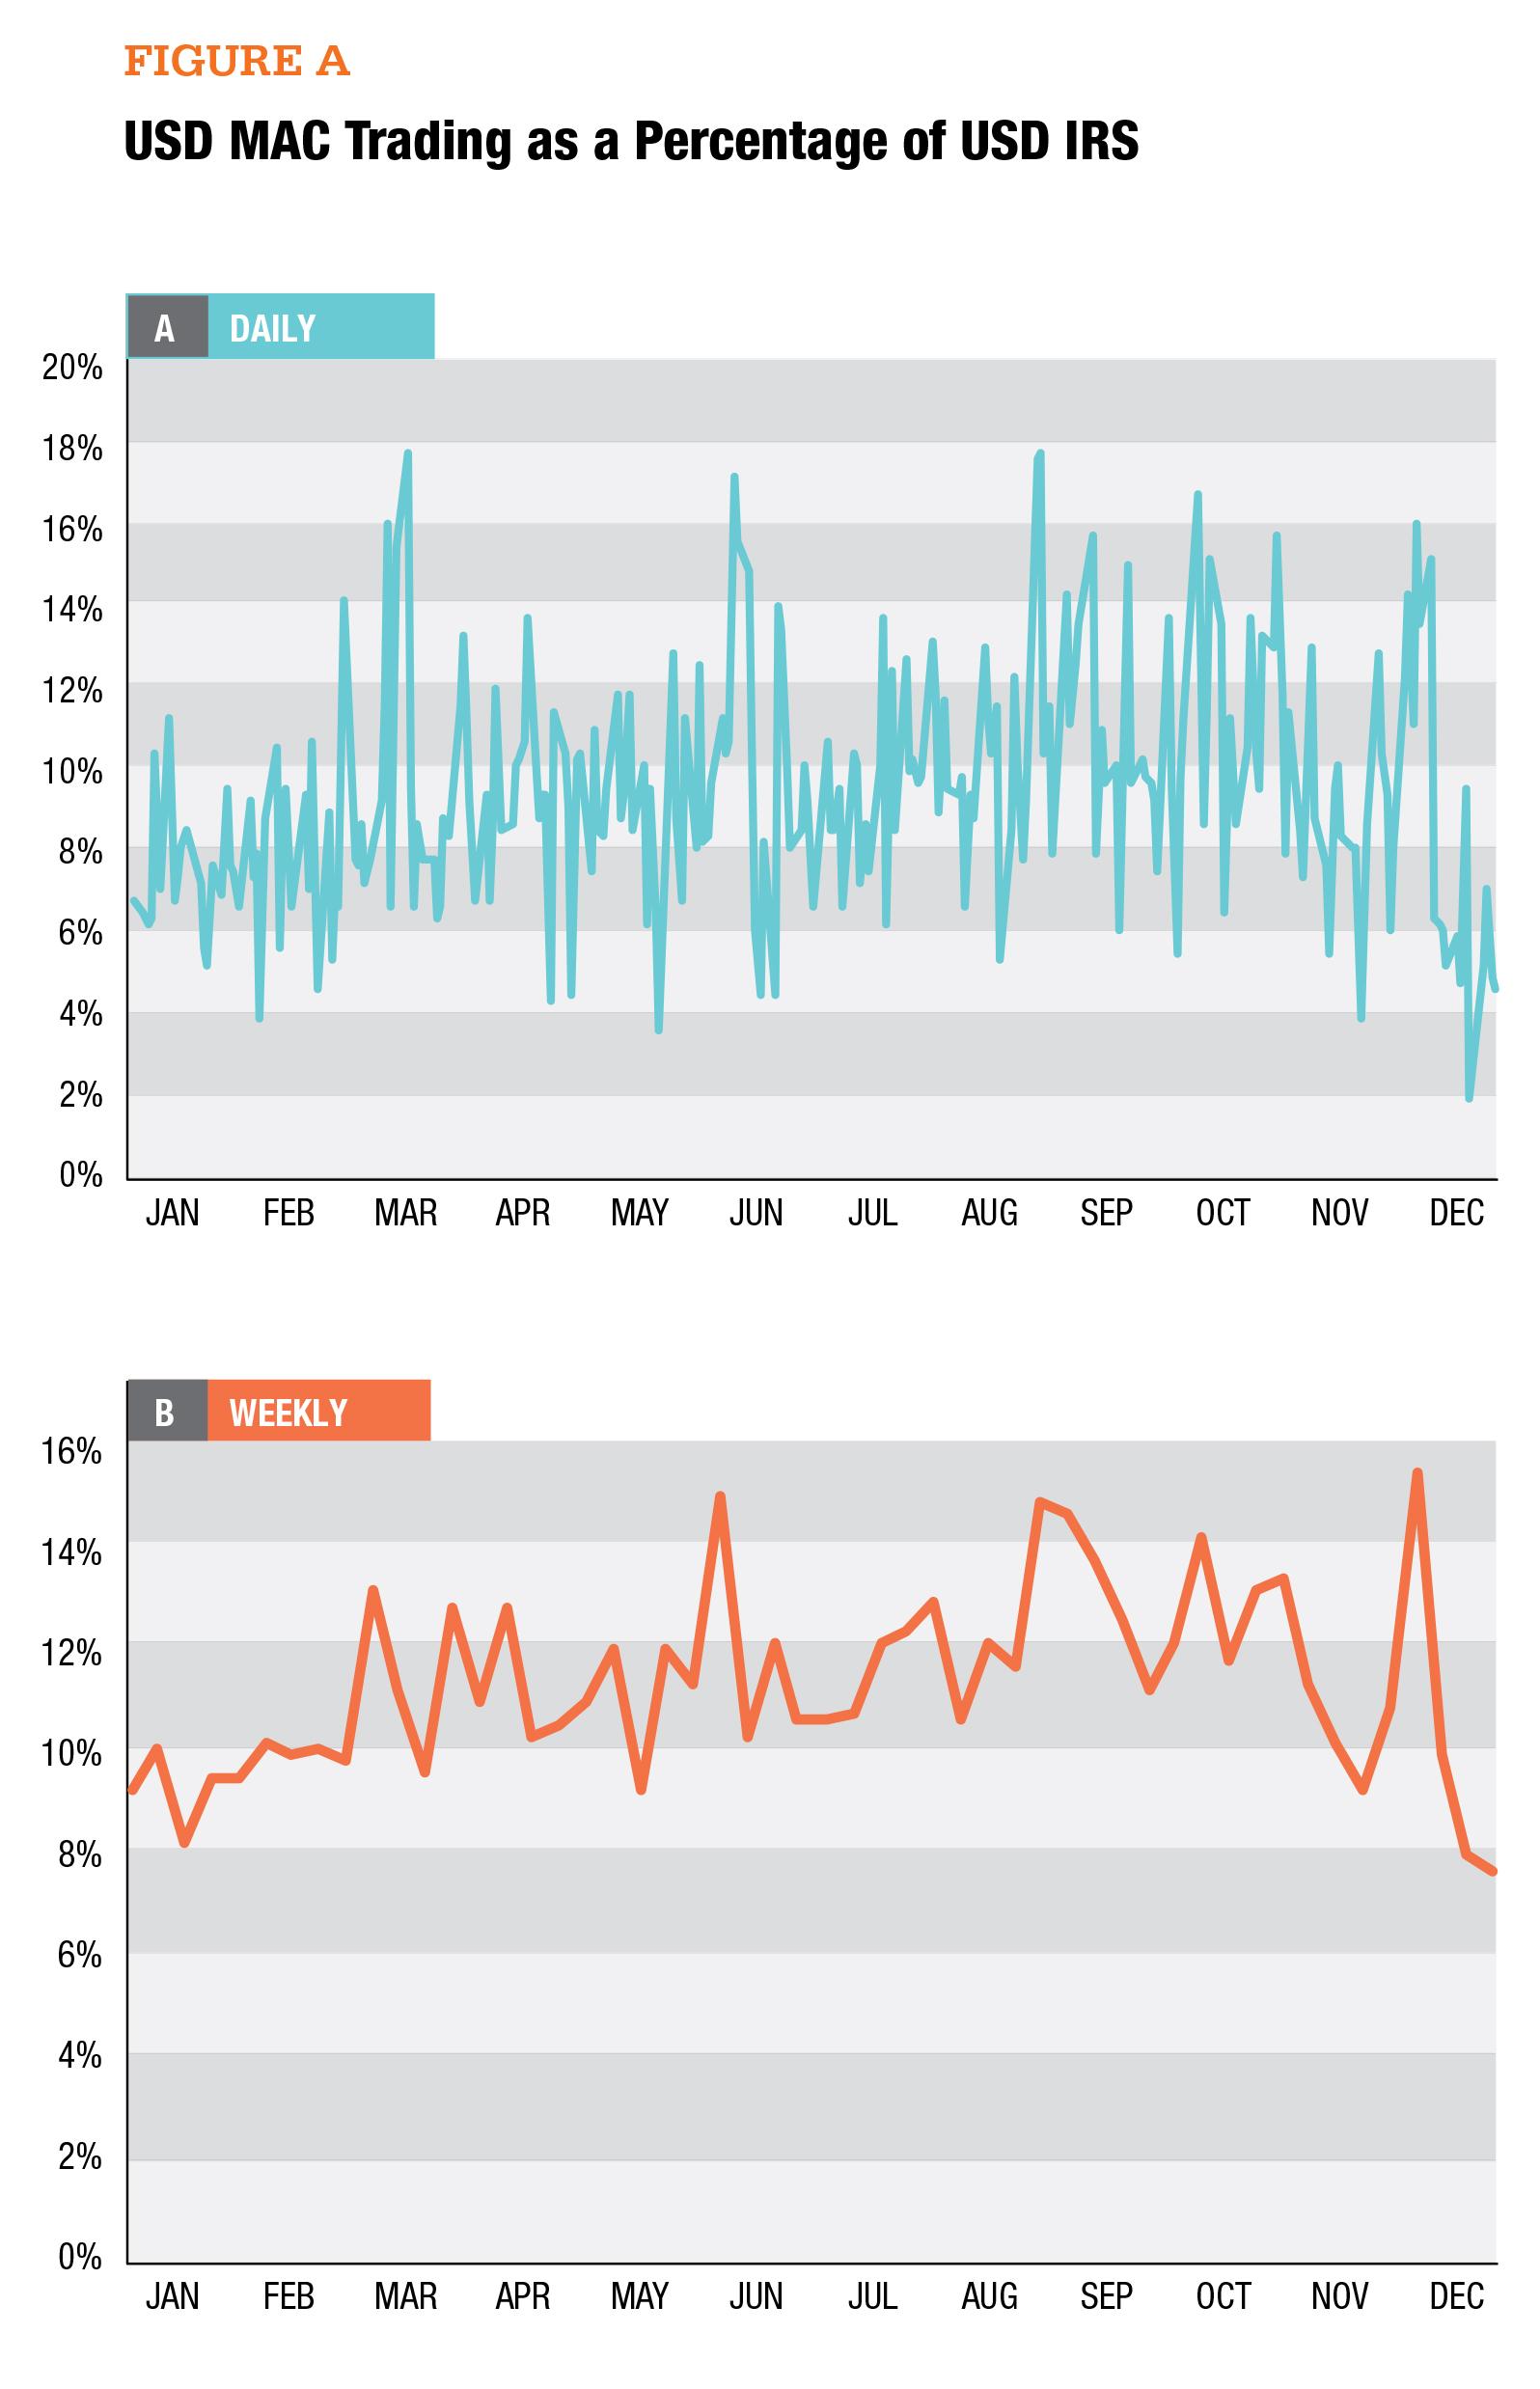
Looking at trade counts reveals a slightly different picture. By this measure, MAC swap trades averaged 9.3% of IRS fixed-float trading, and rose from 15% to 18% around IMM dates (see figure A). Those dates, which are based on the standard expirations for Eurodollar futures contracts traded at CME Group, are part of the standard MAC contract structure. All MAC swaps have effective dates based on IMM dates, and there tends to be a spike of trading activity around these dates as market participants roll their positions to the next set of contracts.
How are MACs traded?
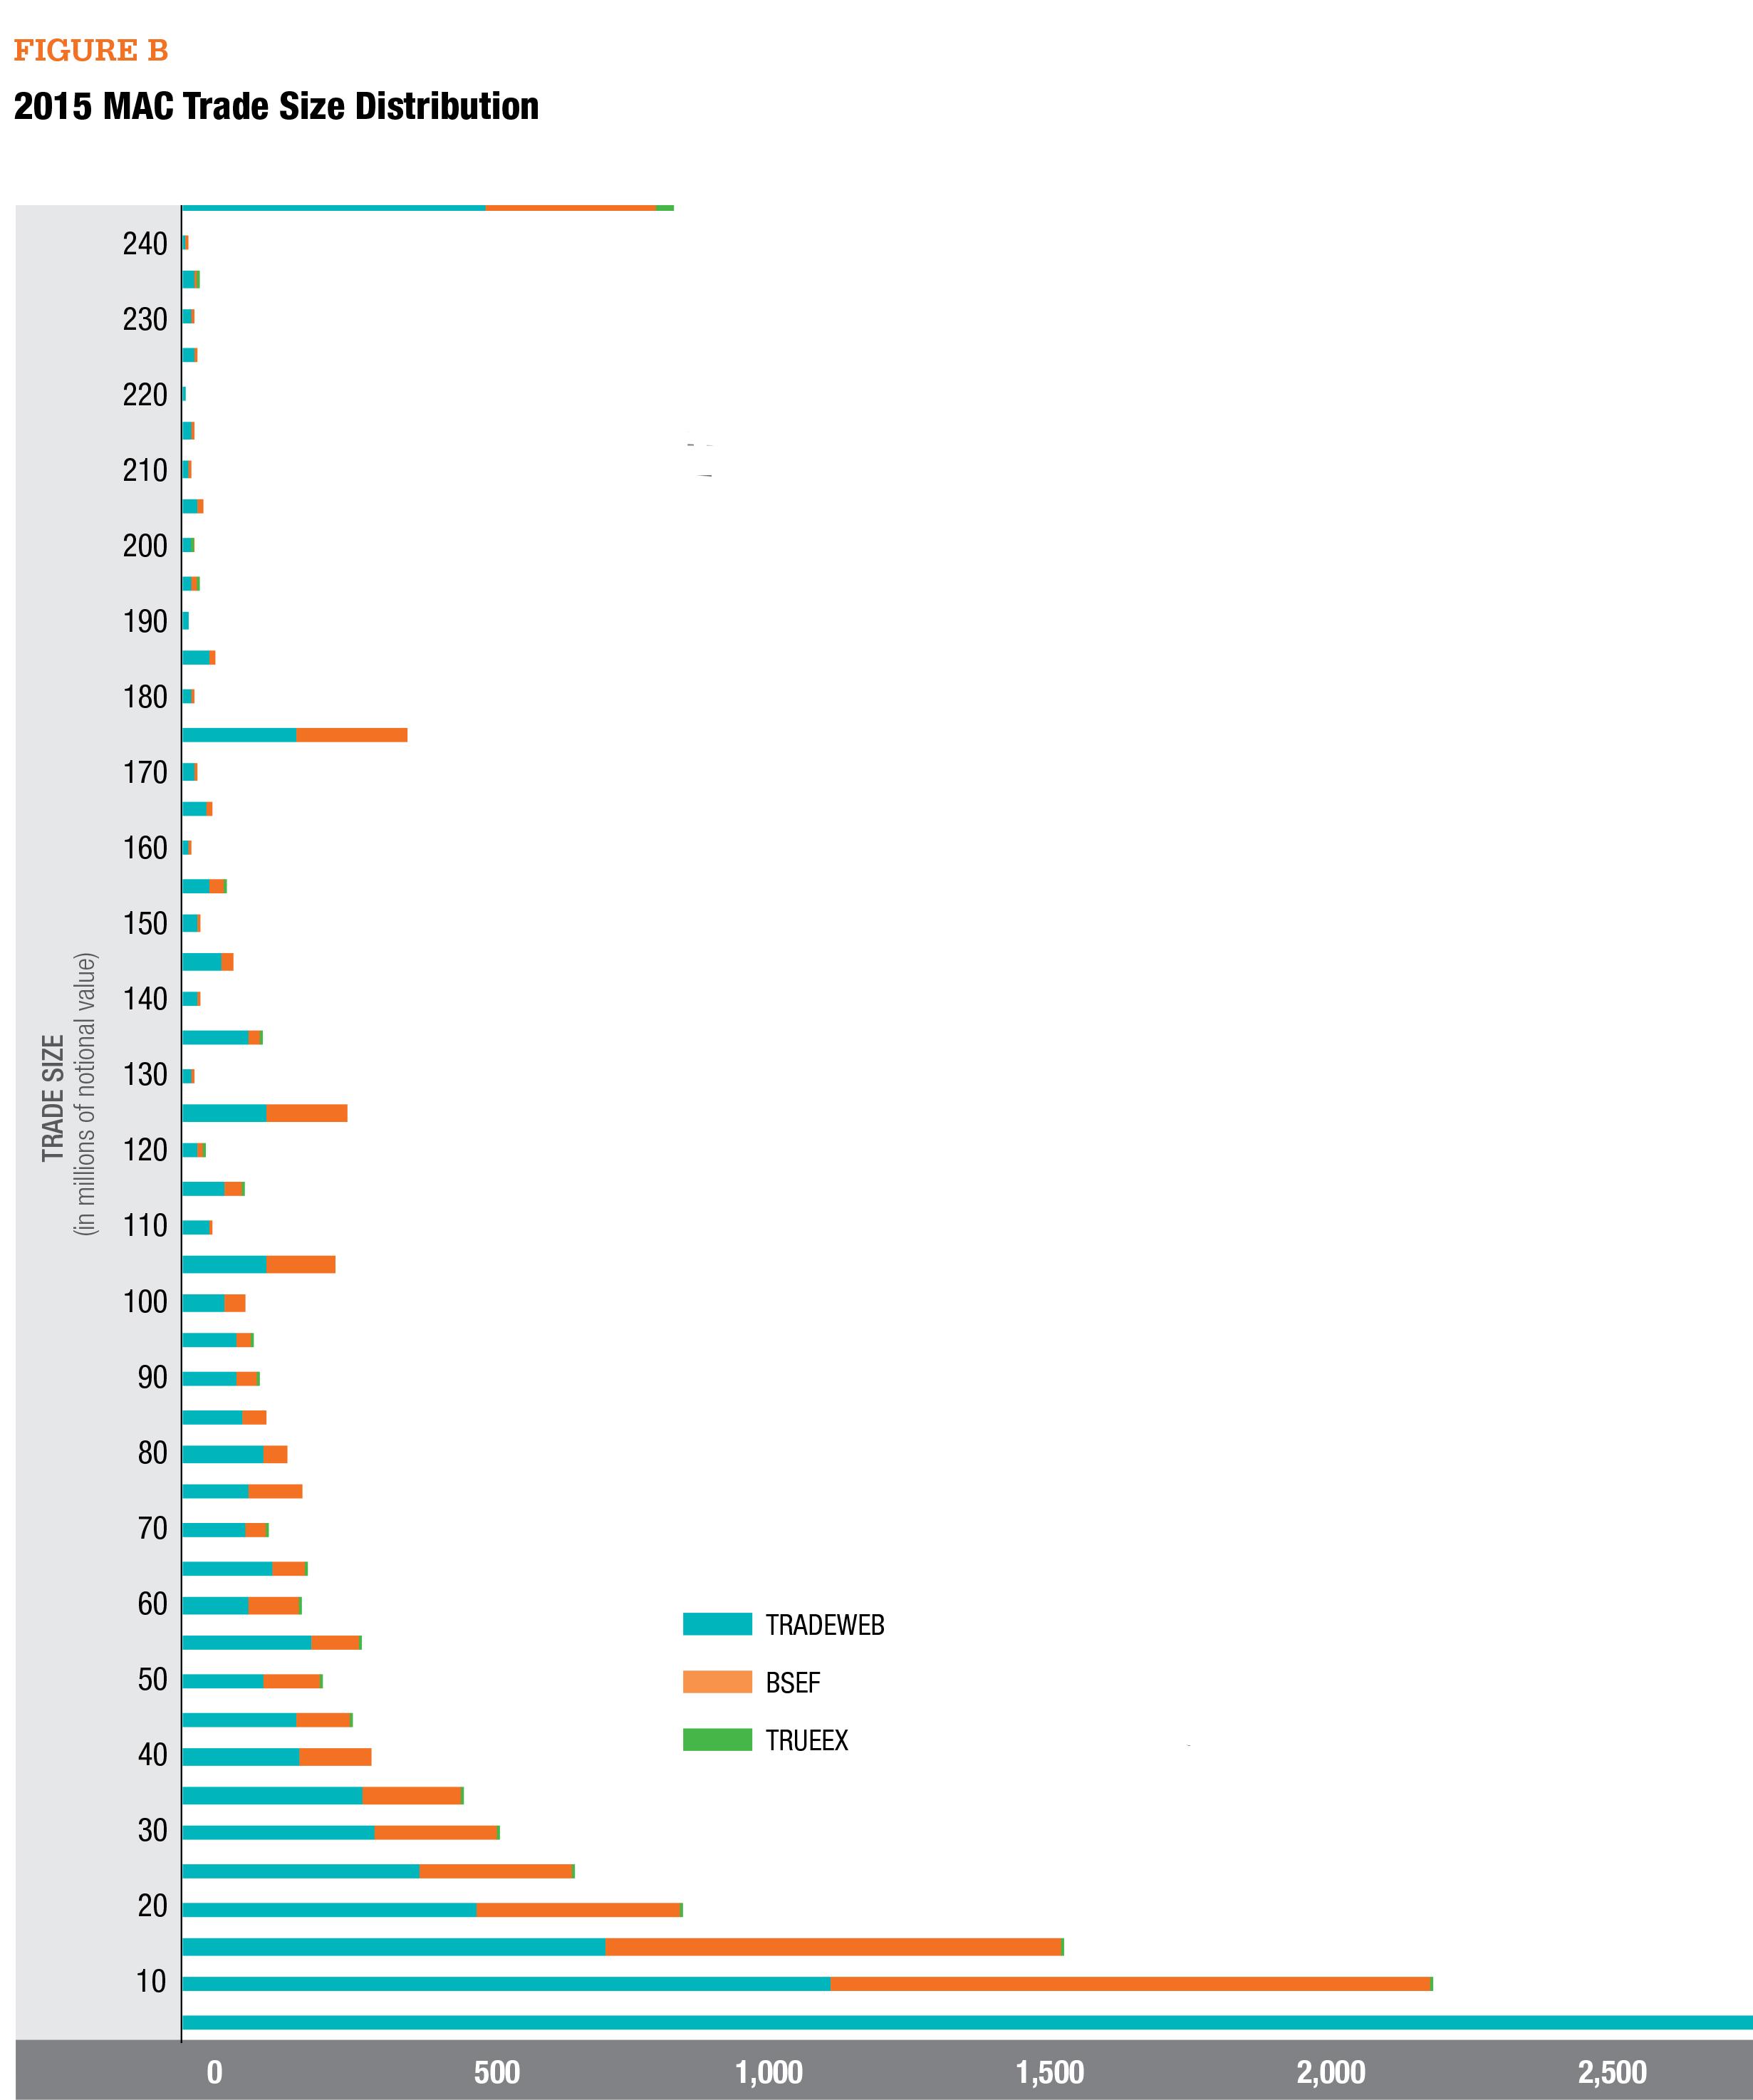
As noted above, the ratio of MAC trading to overall interest rate swap trading was larger when measured by trade count than by notional value. That reflects a tendency to trade MAC swaps in relatively small sizes.
To get a more granular view on trade size, we show the number of trades at each size level, defined by $5 million increment. As figure B shows, the vast majority of MAC trades were in the first three buckets, which comprise trade sizes in $0-$5 million, $5-$10 million and $10-$15 million notional. The exhibit also shows clusters at $120-$125 million, $170-$175 million and greater than $240 million, which correspond to block trade sizes set by the Commodity Futures Trading Commission. The concentration of smaller size trades suggests that MAC swap trading could migrate to a central limit order book, if the number of participants grows and they elect to transact in a central limit order book rather than using the request-for-quote model that currently predominates.
We also analyzed trading strategies by dividing transactions into five types: outrights, which involve a single MAC swap; curve trades, which comprise MACs with two different tenors; butterflies, which consist of three tenors; calendar trades, which involve trading MACs with different expiration dates; and package trades, which consists of all other trades with multiple legs, including trades that include other types of swaps.
Outrights represented 84% of the USD MAC trades in 2015. Curves represented 8%, followed by calendars with 5% and packages with less than 2%. The most popular curve trade was the 5Y-30Y, followed by the 10Y-30Y. Interestingly, more than half of the packages were strips that covered four points on the interest rate curve: 2Y-5Y-10Y-30Y.
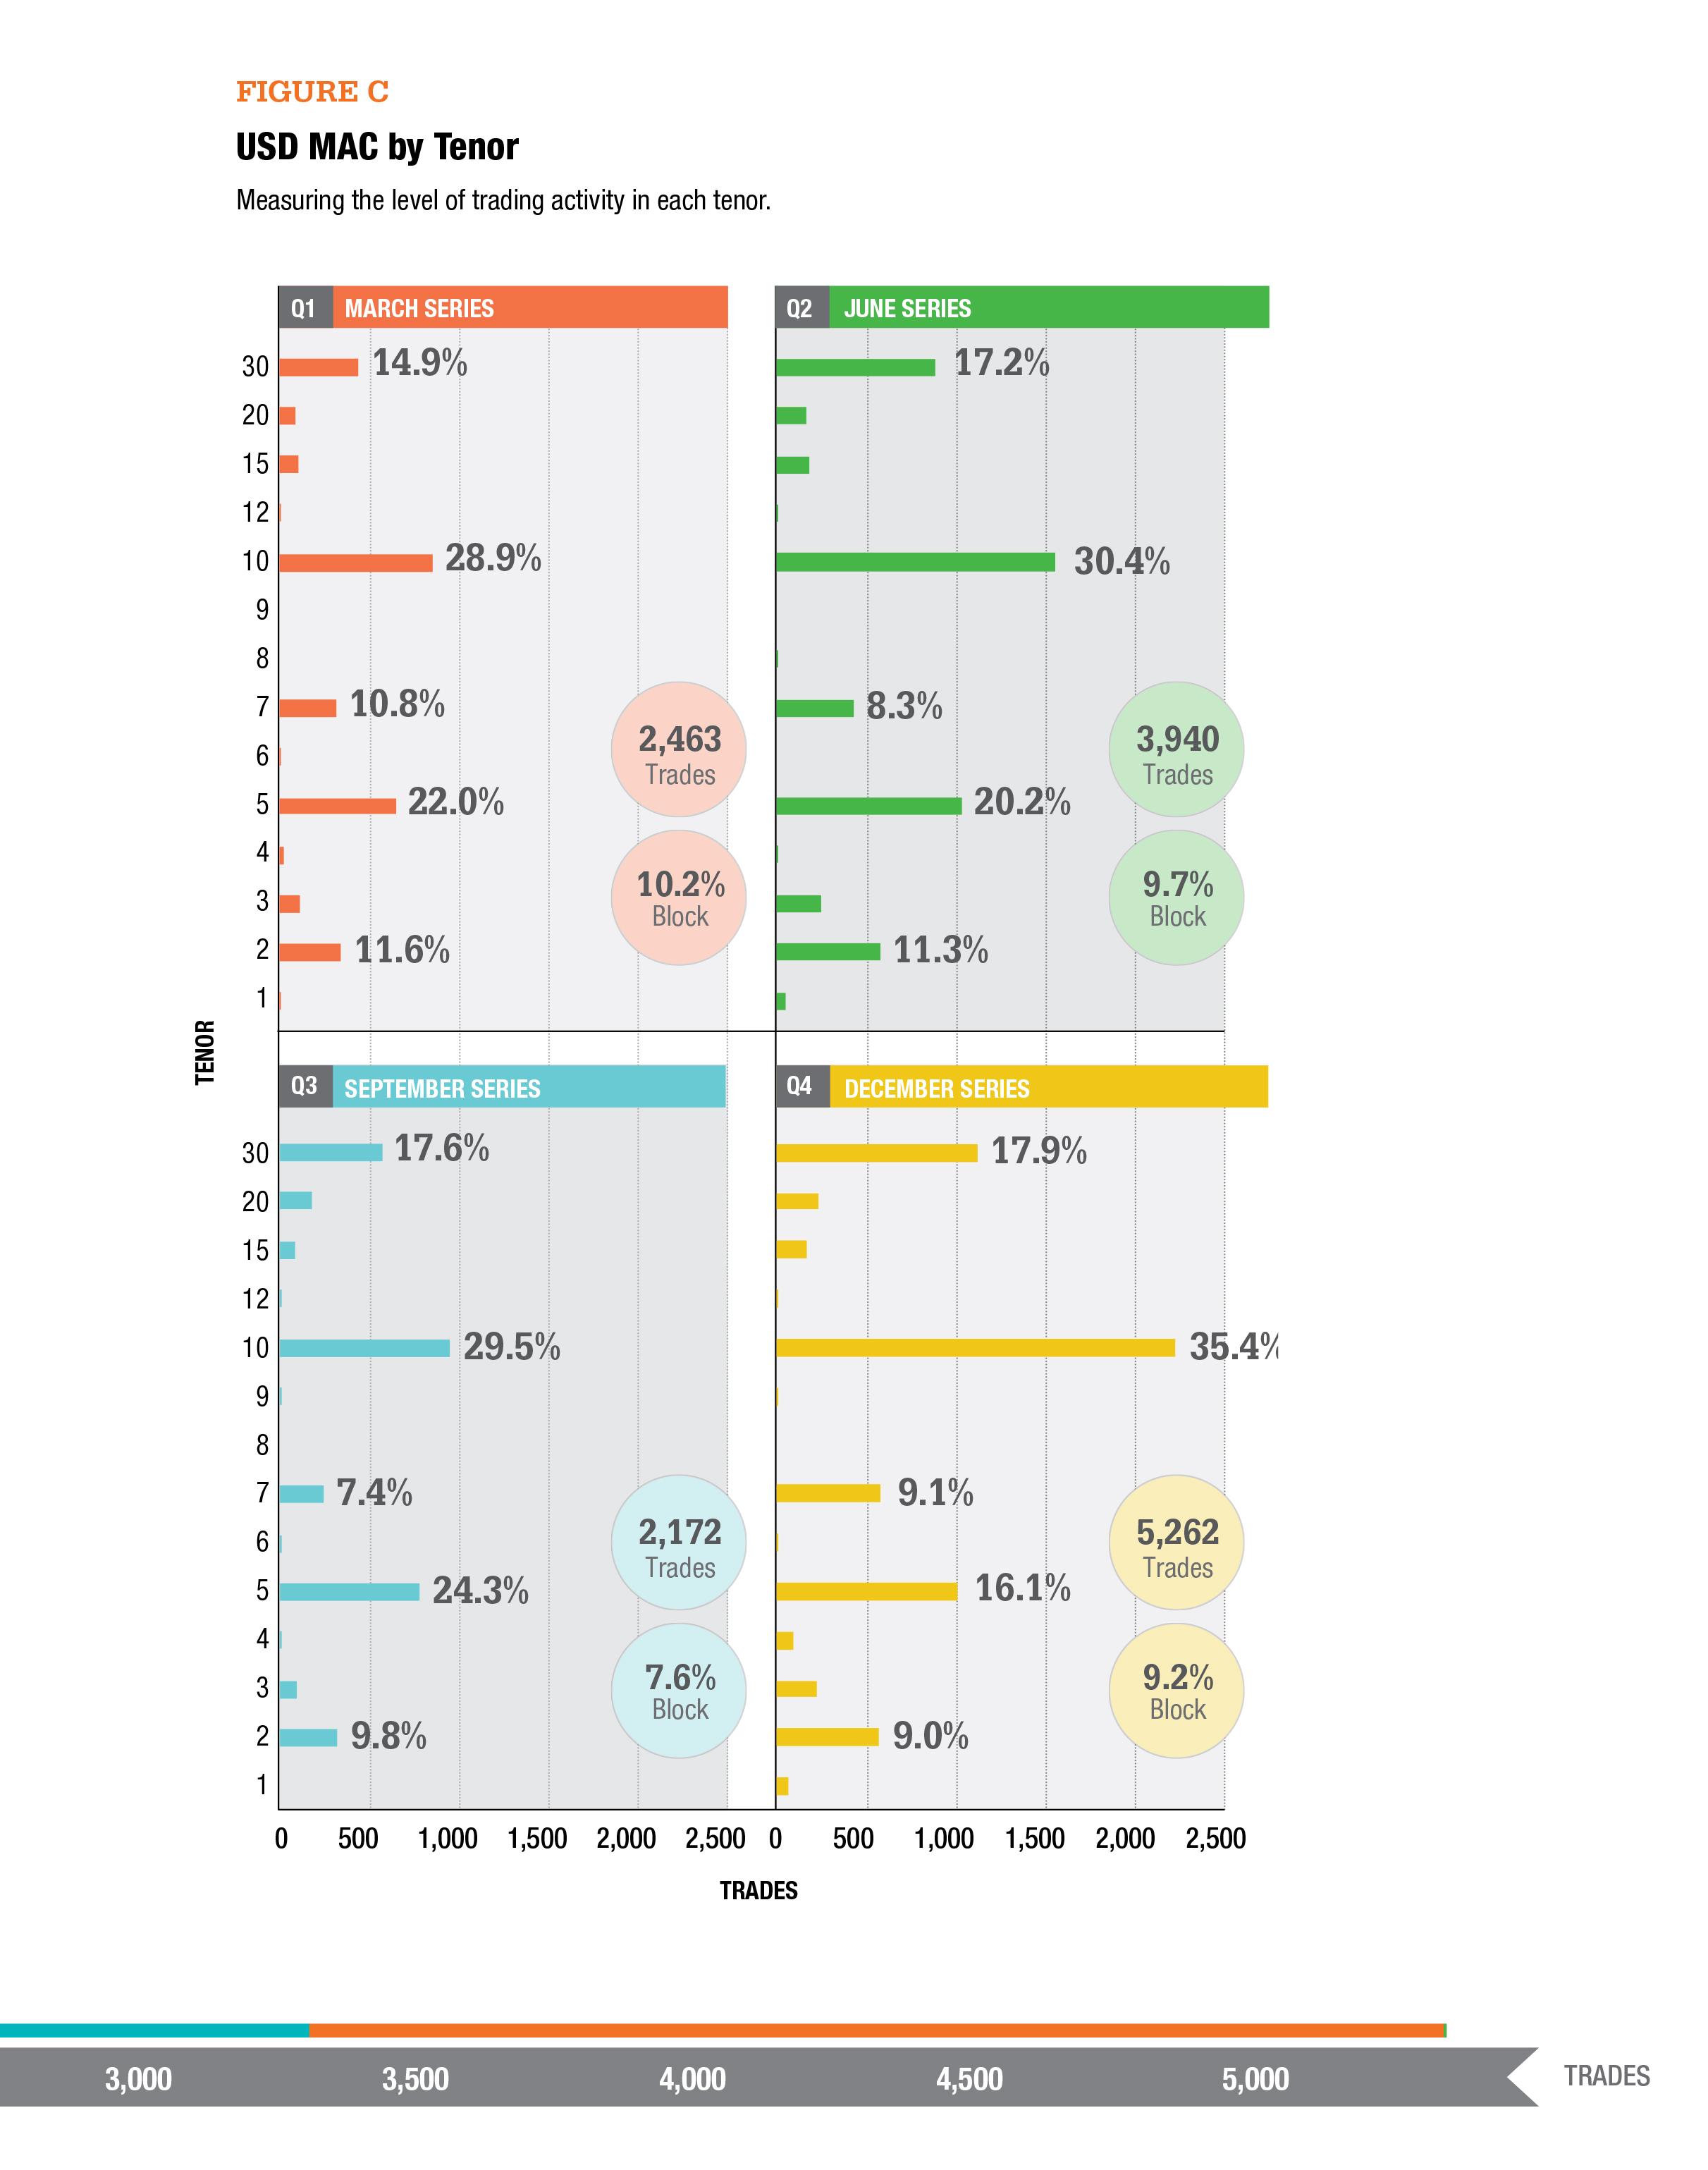
Which tenors were the most active?
In this section, we break down the transaction count data by tenor to provide a more granular view into MAC trading activity. Dollar-denominated MAC swaps are available in 14 tenors ranging from one year to 30 years. We also sort the data by series, i.e., the IMM dates (March, June, September and December) that define the effective date for the swap. For this analysis, we include 2014 data for March and June IMM effective dates to reflect when those series began trading.
As shown in figure C, the 10-year tenor was the most actively traded, accounting for 28.9% to 35.4% of total MAC trading in each series. The 5-year was the next most actively traded, followed by the 30-year, the 2-year and the 7-year, in that order.
Figure C also shows that the December series was much more heavily traded than the other three, with more than 2,000 trades in the 10-year and more than 5,000 trades overall. That series also stood out for having a greater proportion of back month trading. Each series is available for trading over 27 weeks. In the three series leading up to December, trading activity was very low until weeks 13-14, when that series became the front month, and again in week 26, when market participants adjusted their positions ahead of the IMM effective date. The December series, in contrast, had a noticeable amount of back month trading. Roughly a third of the trading in this series took place during the first 12 weeks.