I remember Rich Sandor, who was the guest speaker at a 10th anniversary celebration dinner sponsored by LIFFE, opening by likening himself to Elizabeth Taylor’s most recent husband. “I know what I’m supposed to do,” he said. “The challenge will be to make it interesting.”
How true. In many ways, the year just past looks like the several years that preceded it. Trading volumes have grown. This is still chiefly a financial business. Markets outside of the U.S. continue to grow faster than those in the U.S. And the volume numbers have been skewed again by the staggering number of Kospi options traded on the Korea Stock Exchange.
Fortunately, in addition to the usual ebbing and flooding of trading activity, the European invasion of Chicago provides an excellent object of discussion for this year’s review; electronic trading has breathed new life into foreign exchange futures trading; and the 2.8 billion Kospi options that traded last year raise an interesting question about just how one should evaluate the growth of the market for exchange-traded derivatives.
Broad developments
Overall futures and options trading volume increased 30% last year, which is slightly less than the 37% rate of growth in 2002 and the 47% growth in 2001. In absolute terms, the trend looks the opposite. The absolute increase in overall futures and options trading was 1.90 billion contracts in 2003, up from an increase of 1.61 billion in 2002 and 1.16 billion in 2001. Options trading grew slightly faster (32%) in 2003 than did futures trading (27%), but much of the difference can be attributed to the 50% increase in Kospi options at the KSE. Otherwise, markets in the U.S. and abroad experienced roughly the same kind of growth.
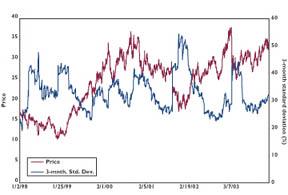
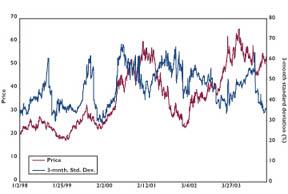
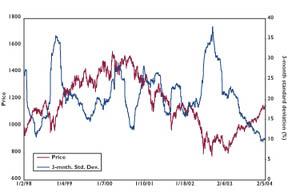
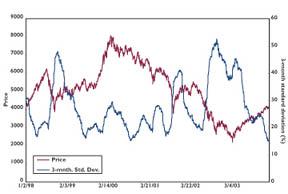
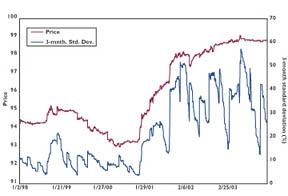
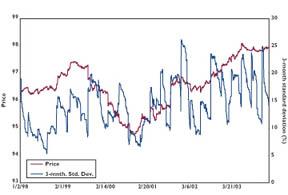
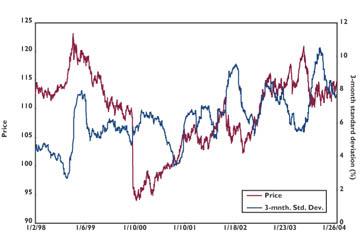
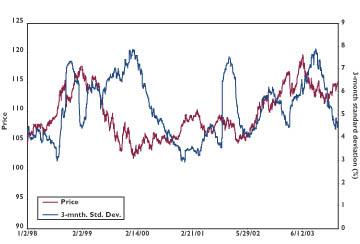
The growth of futures and options trading last year is all the more remarkable because it took place against a backdrop of mainly steady to lower volatility. Stock prices in all the major world stock markets were substantially less volatile in 2003 than in the year before. Government bond volatility as measured by the volatility of the Euro-Bund and 10-year Treasury note contract was somewhat higher, but deposit rate volatility, if measured in basis points, was slightly lower. Energy volatility was very little changed.
Electronic inroads
Electronic trading is a way of life outside of the U.S., and given the lessons we continue to learn in the U.S., it may finally be safe to say that electronic trading will eventually dominate trading in the U.S.
For one thing, the E-mini contracts at Chicago Mercantile Exchange have done wonders both for stock index and foreign exchange trading. For example, trading in E-mini S&P 500 futures increased 39% to 161 million contracts last year, while pit trading in the S&P 500 “big” contract actually fell 15% to 20 million contracts. The same was true for E-mini trading in the Nasdaq 100 and Russell 2000 indexes.
For another, electronic trading may actually be breathing new life into exchange-traded foreign exchange, which has been losing both volume and market share for years. Last year, for the first time in many years, forex futures trading volume actually increased, and most of this was done on Globex.
New guys on the block
For the first time, this year’s volume data include results from the Dalian Commodities Exchange (a Chinese exchange that does a huge trade in soy bean futures) and Bovespa (a Brazilian exchange that trades equity and equity index options). Both rank in the top 20 globally. The FIA has back filled its database so the inclusion of these new exchanges does not skew the growth figures, and we welcome their presence in the survey.
Top ten
Keeping an eye on the top ten of just about everything is a useful way of staying in touch with major developments in the industry. Of the top ten exchanges, for example, the first six kept their 2002 rankings. The International Securities Exchange moved up to seven, though, which reflects its continued inroads into the stock option business. The Chicago Board Options Exchange enjoyed some volume growth last year (6%), but the ISE experienced more (61%) and has closed the volume gap with the CBOE considerably. Also, Bovespa and the Mexican Derivatives Exchange muscled their way onto the list of ten largest exchanges. In Bovespa’s case, it was trading in stock options that did the job, while at Mexder it was a 28-day interest rate contract that was responsible for its growth.
To cement further the idea that interest rates are the real foundation of this business, six of the ten contracts with the largest growth in volume were on interest rates. Three, including the formidable Kospi 200 option, were based on equities and one on an agricultural product. At the other end of the growth spectrum, we find that five of the 10 largest decreases in trading volume were equity contracts, two were interest rate contracts, two were based on energy products, and one was based on a currency exchange rate.
Interest rates
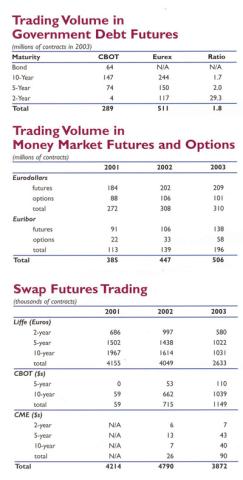
Eurodollar trading in the U.S. was flat, while trading in Treasury futures increased 40%. In Europe, trading in Euribor contracts was up 41%, while trading in EuroGerman contracts (i.e., the Eurobund/bobl/schatz complex) was up 23%. Some of the patterns that seem to bear watching are these.
Eurodollar trading in the U.S. is a huge business and, partly because of the extreme changes that have influenced the short end of the dollar deposit curve, trading volume has exceeded 300 million contracts for the second year in a row. On the other hand, trading in Euribor contracts is growing relatively faster than Eurodollar trading. Over the past two years, total Euribor contract volume has increased from 113 million to 196 million contracts, while Eurodollar trading has increased from 272 million to 310 million contracts. The difference in growth rates may reflect two forces: one, the maturation of the Euro-based yield curve and the more rapid growth of the Euro swap market as compared to the dollar swap market, and two, the fact that Euronext.Liffe uses an all-electronic trading market.
One of the main factors driving Eurodollar volume during the course of the year was hedging activity emanating from the U.S. mortgage market. Deflation fears early in the year drove the 10-year Treasury rate to unusually low levels, fueling a mortgage refinancing boom that encouraged very active trading of Eurodollar futures and options. When Treasury yields reversed direction in June and July, refinancings slowed dramatically, and Eurodollar trading slowed in response.
In the government debt market, Eurex contracts still enjoy the greater market share. Last year, 511 million EuroGerman futures traded on Eurex, while 289 million Treasury futures traded on the CBOT. The greater rate of growth of Treasury trading at the CBOT reflected a pronounced acceleration of a shift to the middle part of the Treasury yield curve. While trading in 30-year Treasury bond futures was up (14%) for the first time in a while, trading increased 53% in 10-year note futures and 45% in 5-year note futures. In the broad sweep of things, then, the 5 and 10-year parts of the Treasury yield curve now dominate Treasury futures trading. What is still missing is an active 2-year Treasury note contract. While Euro-Schatz futures traded 117 million contracts last year, the 2-year note contract at the CBOT traded only 4 million.
Equities
In addition to the influence of E-mini equity futures on the growth and shape of equity index trading, several other factors were at work. Options on individual equities had an up year in the U.S. after being down 3% in 2002. Pan-European index options like the DJ Euro Stoxx 50 are moving up, while national index options such as the DAX and CAC 40 are moving down. This reflects an interesting consolidation of Europe as an equity market and helps to solidify the notion of European economic union. There was a pick up in trading of Japanese equity index contracts, which may reflect a change in investment managers’ view of the Japanese market. The very small value Kospi 200 option on the Korea Stock Exchange yet again experienced a breathtaking increase in trading volume.
Commodities
While commodities account for a relatively small fraction of global futures and options trading, they have been attracting the attention of some major hedge funds and have enjoyed, at least in metals and agricultural commodities, increases in trading activity. Metals trading, both precious and non-precious, was up 26%, while trading in agricultural commodities was up 31%. In contrast, trading in energy contracts was up only about 4%, mainly because of a sharp decline in natural gas futures and options trading at the New York Mercantile Exchange.
Competitive influences on trading volume
A titanic competitive struggle is now underway in Chicago. Four of the largest futures exchanges in the world are engaged in a battle for dollar-denominated interest rate futures trading. Eurex, which dominates European government bond futures trading, opened up its markets for Treasury bond and note futures on Feb. 8. And Euronext Liffe, which has the market for Euribor futures and options trading, has scheduled the opening of its Eurodollar futures market for March 18.
Their efforts also shed light on some important aspects of the way exchanges compete with one another. For example, trading costs will be an important factor in determining whether Eurex will succeed in its effort to gain a foothold in Treasury futures trading. Yet Eurex has not chosen to compete in this area as intensely as it could. To be sure, it had lower exchange fees than the CBOT until the CBOT dropped its own fees to match Eurex. But it did not do what many observers thought it would, and that is cut the tick size in half in the markets that really matter—10-year and 5-year Treasury note futures. Granted, the tick size for the Eurex Treasury bond contract is 1/64th, which is half that for the CBOT’s bond contract, but it is also 1/64th for the 10s and 5s. As a result, the all-in costs of trading Treasury note futures—the bid/ask spread plus brokerage and exchange fees—are roughly the same in both markets.
Whether Eurex can wrest Treasury futures trading from the CBOT or Euronext.Liffe can take any Eurodollar market share from CME is a wide open question. But one thing is clear. Their challenge to the Chicago exchanges has increased competitive pressures and will make it cheaper and easier for the ultimate users to trade these contracts.
What is the measure of a market?
My editors at Futures Industry have asked from time to time whether we might not consider different ways of measuring the size and growth of the futures market. Trading volume is an excellent measure for a large part of the industry because the incomes of market makers and brokers are directly related to the number of contracts traded. Traders and hedgers, on the other hand, are more interested in how much risk they can take or lay off, which suggests a measure that takes into account the portfolio values of the contracts traded.
The 2.8 billion Kospi options that traded on the Korea Stock Exchange provide an interesting example of why the distinctions matter. It seems that every year for the past several years, there has been a small contract somewhere in the world that has skewed the growth numbers. Sometimes it has been French equity futures, sometimes green bean futures in China, and sometimes interest rate options in Brazil. In most of these cases, though, while the trading volumes were large, they did not completely dominate the picture. This year, though, the Kospi experience swamped the data and made it impossible to ignore the question.
The Kospi options illustrate three things that matter when considering the size of a market. First, the contract is comparatively small. The option is defined in such a way that the value of the underlying stock portfolio is about $6,000. Second, the contract exhibits a hellishly high relative trading velocity. The year-end open interest in the options was only 3.1 million, which means that the open interest turned over 915 times over the course of 2003, or about 4 times a day. Even by speculative standards, this is a high rate of turnover. Third, they are options with deltas less than 1.0. As a result, the portfolio exposure represented by open positions in the options might be as little as half as much as the value of the underlying stock portfolio.
Volume, open interest, and relative trading velocity
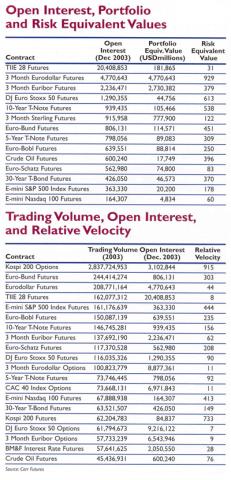
For many market participants, a more relevant measure of market size is open interest. Often, for the sake of not representing too large a share of any given market, traders’ positions are not allowed to exceed a given percentage of a market’s open interest, so the depth of the open interest is an important indication of the market’s ability to handle large orders. Likewise, trading velocity, which measures the speed with which contracts circulate within the market, can be viewed as another indicator of liquidity. A relatively high velocity reading indicates the presence of large amounts of speculative, in-and-out trading compared to longer-term position taking, and generally would be associated with relatively tight bid-ask spreads. The table called Trading volume, open interest, and relative velocity shows just how different contracts can be in these three respects.
For example, the Kospi 200 option, which far outranks the rest of the field in terms of trading volume, drops to eighth overall in terms of open interest. Because its open interest is so small relative to its trading volume, it has a relative trading velocity of 915. At this rate, open interest in these options turns over nearly four times a day. The TIIE 28 interest contract at the Mexican Derivatives Exchange, on the other hand, had 20.4 million contracts outstanding at year-end, first place in terms of open interest. But because total volume for the year was only 162 million, its relative trading velocity was only eight, which was second from the bottom of the table.
It is interesting to note that while the turnover rate for Kospi 200 options is huge, it is only about twice as fast as the rate at which the E-mini equity futures turn over at the CME.
Portfolio and risk equivalent values
Once you start thinking about the size of open positions and what they represent, you have at least two more ways of thinking about the size of a market. One is in terms of the portfolio equivalent value of open positions. Another is in terms of the risk that those open positions represent.
Portfolio equivalent value is a useful enough concept if one is thinking about markets that are like one another. For example, a single Eurodollar futures contract might be thought of as the equivalent of $1,000,000 of a 3-month time deposit, while a 10-year note contract at year-end (trading at a price of 112 and change) could be thought of as having a value equal to that of $112,000 of a comparable maturity Treasury note. With these values, the 4,770,643 Eurodollar contracts outstanding at the end of 2003 would have a portfolio equivalent value of $4,770,643 million ($4.7 trillion) as shown in the table called Open interest, portfolio and risk equivalent value (which is limited to futures contracts to skirt the problem of not knowing options’ deltas). A number like this would make sense to bankers who think in terms of money market risk. In contrast, the 939,435 10-year Treasury note contracts outstanding would have had a portfolio equivalent value of $105,466 million, which might be compared with a portfolio of Treasury notes.
The most serious shortcoming of portfolio equivalent values is that while they make sense within a market, they are not useful across markets because they represent different kinds of risks. To show how much this matters, we calculated the numbers shown in the risk equivalent value column by multiplying year end open interest, the standard deviation of daily price changes and the value of a price point in each market. The resulting product represents one standard deviation of the change in the value of open positions in each market. For example, a one standard deviation change in the value of open Eurodollar positions in 2003 (using year-end open interest as the size of open positions) was $929 million per day. The next largest market was the DJ Euro Stoxx 50 contract with a daily standard deviation of $613 million. Ten-year Treasury note futures ranked third with a daily standard deviation of $538 million. And by this measure, the 3-month Sterling contract, which ranked sixth in year-end open interest, would have ranked third to last in terms of risk equivalent exposure.
Focusing on risk also helps us to ferret out truly small contracts that may have a large influence on global trading volume and open interest but that wield comparatively small economic influence. A case in point is the TIEE 28 interest rate contract at the Mexican Derivatives Exchange. Year-end open interest in was 20 million contracts, which placed it at the top of the list of the most active futures contracts. With a notional value of 100,000 Mexican pesos, the portfolio equivalent value of these contracts was $181 billion, which placed it somewhere in the middle of the pack. On a risk equivalent basis, though, it ranked dead last. The daily standard deviation of changes in the value of the open positions was only $31 million.
Bringing up the rear
We have been keeping our eye on two markets with the hope that they would take off and become real forces in the futures business. One is single stock futures. The other is swap futures. At this writing, it seems that single stock futures are slowly gaining ground. Total contract volume grew from 32 million in 2002 to 55 million in 2003. This is still not much, but growth is growth, and these contracts are laboring under especially onerous rules and regulations. On a global basis, OneChicago ranked fifth in total contract volume, while NQLX ranked eighth. Some exchanges enjoyed a double or tripling of trading volume, and the Australian Stock Exchange is a newcomer to the list.
Swap futures, though, seem not be to going anywhere. Volume at the CBOT and CME is growing but from a small base. Swap futures trading at Euronext.liffe, which had been showing signs of promise, has been falling, and the overall volume total is in a downward trend. I can only assume that the world conspires to make sure I’m wrong about what will and won’t succeed.
Top twenty contracts (in millions—net of individual equities)
| Rank | Contract | Exchange | 2003 | 2002 | Change | % Change |
| 1 | Kospi 200 Options | KSE | 2,837.72 | 1,889.82 | 947.9 | 50.16% |
| 2 | Euro-Bund Futures | Eurex | 244.41 | 191.26 | 53.15 | 27.79% |
| 3 | 3-Month Eurodollar Futures | CME | 208.77 | 202.08 | 6.69 | 3.31% |
| 4 | TIIE 28 Futures | MexDer | 162.08 | 80.6 | 81.48 | 101.10% |
| 5 | E-Mini S&P 500 Index Futures | CME | 161.18 | 115.74 | 45.43 | 39.26% |
| 6 | Euro-Bobl Futures | Eurex | 150.09 | 114.68 | 35.41 | 30.88% |
| 7 | 10-Year T-Note Futures | CBOT | 146.75 | 95.79 | 50.96 | 53.20% |
| 8 | 3-Month Euribor Futures | Euronext | 137.69 | 105.76 | 31.94 | 30.20% |
| 9 | Euro-Schatz Futures | Eurex | 117.37 | 108.76 | 8.61 | 7.92% |
| 10 | DJ Euro Stoxx 50 Futures | Eurex | 116.04 | 86.35 | 29.68 | 34.37% |
| 11 | 3-Month Eurodollar Options | CME | 100.82 | 105.58 | -4.76 | -4.51% |
| 12 | 5-Year T-Note Futures | CBOT | 73.75 | 50.51 | 23.23 | 46.00% |
| 13 | CAC 40 Index Options | Euronext | 73.67 | 84.34 | -10.67 | -12.66% |
| 14 | E-Mini Nasdaq 100 Futures | CME | 67.89 | 54.49 | 13.4 | 24.59% |
| 15 | 30-Year T-Bond Futures | CBOT | 63.52 | 56.08 | 7.44 | 13.26% |
| 16 | Kospi 200 Futures | KSE | 62.2 | 42.87 | 19.34 | 45.11% |
| 17 | DJ Euro Stoxx 50 Options | Eurex | 61.79 | 39.48 | 22.32 | 56.53% |
| 18 | No. 1 Soybean Futures | DCE | 60 | 12.69 | 47.31 | 372.82% |
| 19 | 3-Month Euribor Options | Euronext | 57.73 | 33.48 | 24.25 | 72.43% |
| 20 | Interest Rate Futures | BM&F | 57.64 | 48.57 | 9.07 | 18.68% |
Largest changes in individual contract volume (Net of individual equities)
| Gains (in millions) | ||||||
| Rank | Contract | Exchange | 2003 | 2002 | Change | % Change |
| 1 | Kospi 200 Options | KSE | 2,837.72 | 1,889.82 | 947.9 | 50.20% |
| 2 | TIIE 28 Futures | MexDer | 162.08 | 80.6 | 81.48 | 101.10% |
| 3 | Euro-Bund Futures | Eurex | 244.41 | 191.26 | 53.15 | 27.80% |
| 4 | 10-Year T-Note Futures | CBOT | 146.75 | 95.79 | 50.96 | 53.20% |
| 5 | No. 1 Soybean Futures | DCE | 60 | 12.69 | 47.31 | 372.80% |
| 6 | E-mini S&P 500 Futures | CME | 161.18 | 115.74 | 45.43 | 39.30% |
| 7 | Euro-Bobl Futures | Eurex | 150.09 | 114.68 | 35.41 | 30.90% |
| 8 | Euribor Futures | Euronext | 137.69 | 105.76 | 31.94 | 30.20% |
| 9 | DJ Euro Stoxx 50 Futures | Eurex | 116.04 | 86.35 | 29.68 | 34.40% |
| 10 | Euribor Options | Euronext | 57.73 | 33.48 | 24.25 | 72.40% |
| Declines (in millions) | ||||||
| Rank | Contract | Exchange | 2003 | 2002 | Change | % Change |
| 1 | CAC 40 Index Options | Euronext | 73.67 | 84.34 | -10.67 | -12.70% |
| 2 | Natural Gas Futures | Nymex | 19.04 | 24.36 | -5.32 | -21.80% |
| 3 | Eurodollar Options | CME | 100.82 | 105.58 | -4.76 | -4.50% |
| 4 | Niax 50 Futures | Eurex | 0.75 | 4.7 | -3.95 | -84.10% |
| 5 | S&P 500 Futures | CME | 20.18 | 23.7 | -3.52 | -14.90% |
| 6 | Shekel-Dollar Rate Options | TASE | 8.34 | 11.54 | -3.2 | -27.70% |
| 7 | DAX Options | Eurex | 41.52 | 44.03 | -2.51 | -5.70% |
| 8 | Korea Treasury Bond Futures | Kofex | 10.29 | 12.78 | -2.49 | -19.50% |
| 9 | Natural Gas Options | Nymex | 8.74 | 10.97 | -2.22 | -20.30% |
| 10 | DJ Industrial Index Futures | CBOT | 4.42 | 6.49 | -2.07 | -31.90% |
Volume by category (in millions)
| Global | 2003 | 2002 | Change | % Change |
| Equity Indices | 3,960.87 | 2,791.18 | 1,169.69 | 41.91% |
| Interest Rate | 1,881.27 | 1,478.44 | 402.83 | 27.25% |
| Individual Equities | 1,558.52 | 1,354.70 | 203.82 | 15.05% |
| Ag Commodities | 261.15 | 199.39 | 61.77 | 30.98% |
| Energy Products | 217.56 | 209.37 | 8.19 | 3.91% |
| Non-Precious Metals | 90.39 | 71.57 | 18.82 | 26.29% |
| Foreign Currency/Index | 77.85 | 60.56 | 17.28 | 28.53% |
| Precious Metals | 64.46 | 51.26 | 13.2 | 25.75% |
| Other | 0.66 | 0.8 | -0.14 | -17.14% |
| TOTAL | 8,112.73 | 6,217.28 | 1,895.45 | 30.49% |
| U.S. | 2003 | 2002 | Change | % Change |
| Individual Equities | 791.64 | 679.7 | 111.94 | 16.47% |
| Interest Rate | 678.3 | 579.21 | 99.09 | 17.11% |
| Equity Indexes | 420.55 | 327.72 | 92.82 | 28.32% |
| Energy Products | 112.4 | 115.93 | -3.53 | -3.05% |
| Ag Commodities | 107.86 | 97.7 | 10.16 | 10.40% |
| Foreign Currency/Index | 36.1 | 26.07 | 10.03 | 38.46% |
| Precious Metals | 21.76 | 14.91 | 6.85 | 45.94% |
| Non-Precious Metals | 3.25 | 2.92 | 0.33 | 11.24% |
| Other | 0.66 | 0.73 | -0.07 | -9.85% |
| TOTAL | 2,172.52 | 1,844.90 | 327.62 | 17.76% |
| Non U.S. | 2003 | 2002 | Change | % Change |
| Equity Indices | 3,540.32 | 2,463.46 | 1,076.87 | 43.71% |
| Interest Rate | 1,202.97 | 899.23 | 303.74 | 33.78% |
| Individual Equities | 766.88 | 675.01 | 91.88 | 13.61% |
| Ag Commodities | 153.29 | 101.69 | 51.6 | 50.75% |
| Energy Products | 105.16 | 93.44 | 11.72 | 12.54% |
| Non-Precious Metals | 87.14 | 68.65 | 18.49 | 26.93% |
| Precious Metals | 42.7 | 36.35 | 6.35 | 17.47% |
| Foreign Currency/Index | 41.74 | 34.49 | 7.25 | 21.03% |
| Other | 0 | 0.07 | -0.06 | -98.80% |
| TOTAL | 5,940.22 | 4,372.38 | 1,567.83 | 35.86% |
| Global Futures Volume | |||
|
(In millions) |
2002 |
2003 |
% Change |
| U.S. Futures |
851.31 |
1,042.97 |
22.51% |
| Non-U.S. Futures |
1,473.60 |
1,927.54 |
30.80% |
| Futures Volume |
2,324.91 |
2,970.51 |
27.77% |
| Global Options Volume | |||
| (In millions) |
2002 |
2003 |
% Change |
| U.S. Options | 993.59 |
1,129.55 |
13.68% |
| Non-U.S. Options | 2,898.78 |
4,012.67 |
38.43% |
| Options Volume | 3,892.37 |
5,142.22 |
32.11% |
| Grand Total | 6,217.28 |
8,112.73 |
30.49% |
| Global Futures and Options Volume | |||
| (In millions) |
2002 |
2003 |
% Change |
| Equity Indices |
2,791.18 |
3,960.87 |
41.91% |
| Interest Rate |
1,478.44 |
1,881.27 |
27.25% |
| Individual Equities |
1,354.70 |
1,558.52 |
15.05% |
| Ag Commodities |
199.39 |
261.15 |
30.98% |
| Energy Products |
209.37 |
217.56 |
3.91% |
| Non-Precious Metals |
71.57 |
90.39 |
26.29% |
| Foreign Cur/Index |
60.56 |
77.85 |
28.53% |
| Precious Metals |
51.26 |
64.46 |
25.75% |
| Other |
0.8 |
0.66 |
-17.14% |
| Total Volume |
6,217.28 |
8,112.73 |
30.49% |
Energy markets
Crude Oil
Historical Volatilities and Prices
Natural Gas
Historical Volatilities and Prices
Stock prices
S&P 500
Historical Volatilities and Prices
DAX
Historical Volatilities and Prices
Money markets
Eurodollar
Historical Volatilities and Prices
Euribor
Historical Volatilities and Prices
Bond markets
U.S. 10-Year
Historical Volatilities and Prices
Bund
Historical Volatilities and Prices
Top 40 futures exchanges (Volume figures do not include options on futures)
| 2003 Rank | 2002 Rank | Exchange | 2002 Volume | 2003 Volume | % Change |
| 1 | 1 | Eurex | 536,013,920 | 668,650,028 | 24.74% |
| 2 | 2 | Chicago Mercantile Exchange | 444,537,987 | 530,989,007 | 19.45% |
| 3 | 3 | Chicago Board of Trade | 276,316,047 | 373,669,290 | 35.23% |
| 4 | 4 | Euronext | 221,275,462 | 267,822,143 | 21.04% |
| 5 | 7 | Mexican Derivatives Exchange | 84,274,979 | 173,820,944 | 106.25% |
| 6 | 6 | BM&F | 95,912,579 | 113,895,061 | 18.75% |
| 7 | 5 | New York Mercantile Exchange | 107,359,719 | 111,789,658 | 4.13% |
| 8 | 8 | Tokyo Commodity Exchange | 75,413,190 | 87,252,219 | 15.70% |
| 9 | 10 | Dalian Commodity Exchange | 48,407,404 | 74,973,493 | 54.88% |
| 10 | 9 | London Metal Exchange | 56,303,779 | 68,570,154 | 21.79% |
| 11 | 11 | Korea Stock Exchange | 42,868,164 | 62,204,783 | 45.11% |
| 12 | 12 | Sydney Futures Exchange | 33,987,967 | 41,831,862 | 23.08% |
| 13 | 22 | Shanghai Futures Exchange | 12,173,083 | 40,079,750 | 229.25% |
| 14 | 25 | National Stock Exchange of India | 10,199,111 | 36,141,561 | 254.36% |
| 15 | 13 | Singapore Exchange | 32,623,190 | 35,356,776 | 8.38% |
| 16 | 14 | International Petroleum Exchange | 30,233,664 | 33,258,385 | 10.00% |
| 17 | 15 | Central Japan Commodity Exchange | 30,011,863 | 31,538,530 | 5.09% |
| 18 | 16 | OM | 20,208,149 | 22,667,198 | 12.17% |
| 19 | 17 | Tokyo Grain Exchange | 18,670,931 | 21,084,727 | 12.93% |
| 20 | 19 | New York Board of Trade | 16,272,144 | 18,822,048 | 15.67% |
| 21 | 18 | MEFF | 17,314,065 | 17,110,745 | -1.17% |
| 22 | 21 | Tokyo Stock Exchange | 13,630,046 | 15,965,175 | 17.13% |
| 23 | 23 | JSE Securities Exchange South Africa | 11,233,002 | 14,947,523 | 33.07% |
| 24 | 24 | Osaka Securities Exchange | 11,134,754 | 13,231,287 | 18.83% |
| 25 | 20 | Korea Futures Exchange | 14,596,861 | 12,954,907 | -11.25% |
| 26 | 26 | Bourse de Montreal | 8,058,498 | 10,676,279 | 32.48% |
| 27 | 28 | Taiwan Futures Exchange | 6,377,808 | 9,953,118 | 56.06% |
| 28 | 29 | Hong Kong Exchanges & Clearing | 6,228,037 | 8,174,652 | 31.26% |
| 29 | 27 | Italian Derivatives Market | 7,071,028 | 7,302,565 | 3.27% |
| 30 | 30 | Osaka Mercantile Exchange | 5,207,652 | 6,162,589 | 18.34% |
| 31 | 45 | Budapest Stock Exchange | 1,072,566 | 4,939,893 | 360.57% |
| 32 | 32 | Tokyo International Financial Futures Exchange | 4,470,763 | 4,771,917 | 6.74% |
| 33 | 31 | Kansai Commodities Exchange | 4,488,914 | 3,441,365 | -23.34% |
| 34 | 42 | Budapest Commodity Exchange | 1,338,846 | 3,237,088 | 141.78% |
| 35 | 35 | Fukuoka Futures Exchange | 3,170,986 | 2,739,383 | -13.61% |
| 36 | 50 | Rosario Futures Exchange | 399,432 | 2,708,313 | 578.04% |
| 37 | 36 | Kansas City Board of Trade | 2,755,949 | 2,634,424 | -4.41% |
| 38 | 43 | Malaysia Derivatives Exchange | 1,276,787 | 2,009,460 | 57.38% |
| 39 | 41 | Yokohama Commodity Exchange | 1,507,210 | 1,852,158 | 22.89% |
| 40 | 39 | Winnipeg Commodity Exchange | 2,155,796 | 1,811,616 | -15.97% |
Global futures and options volume
| 2003 Rank | 2002 Rank | Exchange | 2002 Volume | 2003 Volume | % Change |
| 1 | 1 | Korea Stock Exchange | 1,932,749,868 | 2,899,937,895 | 50.04% |
| 2 | 2 | Eurex | 801,200,873 | 1,014,932,312 | 26.68% |
| 3 | 3 | Euronext | 696,323,560 | 694,970,981 | -0.19% |
| 4 | 4 | Chicago Mercantile Exchange | 558,447,820 | 640,209,634 | 14.64% |
| 5 | 5 | Chicago Board of Trade | 343,882,529 | 454,190,749 | 32.08% |
| 6 | 6 | Chicago Board Options Exchange | 267,616,496 | 283,946,495 | 6.10% |
| 7 | 8 | International Securities Exchange | 152,399,279 | 244,968,190 | 60.74% |
| 8 | 7 | American Stock Exchange | 186,039,445 | 180,074,778 | -3.21% |
| 9 | 11 | Bovespa | 90,884,897 | 177,223,140 | 95.00% |
| 10 | 14 | Mexican Derivatives Exchange | 84,274,979 | 173,820,944 | 106.25% |
| 11 | 9 | New York Mercantile Exchange | 133,744,435 | 137,225,439 | 2.60% |
| 12 | 10 | BM&F | 101,615,788 | 120,785,602 | 18.86% |
| 13 | 12 | Philadelphia Stock Exchange | 88,955,247 | 112,705,597 | 26.70% |
| 14 | 15 | Tokyo Commodity Exchange | 75,413,190 | 87,252,219 | 15.70% |
| 15 | 13 | Pacific Exchange | 85,426,649 | 86,152,637 | 0.85% |
| 16 | 18 | Dalian Commodity Exchange | 48,407,404 | 74,973,493 | 54.88% |
| 17 | 17 | London Metal Exchange | 58,634,004 | 72,308,327 | 23.32% |
| 18 | 16 | OM | 60,920,817 | 72,137,347 | 18.41% |
| 19 | 21 | Sydney Futures Exchange | 36,243,524 | 44,755,340 | 23.49% |
| 20 | 33 | National Stock Exchange of India | 13,287,113 | 43,081,968 | 224.24% |
| 21 | 34 | Shanghai Futures Exchange | 12,173,083 | 40,079,750 | 229.25% |
| 22 | 19 | Tel-Aviv Stock Exchange | 41,419,705 | 38,098,479 | -8.02% |
| 23 | 22 | Singapore Exchange | 32,887,395 | 35,648,224 | 8.39% |