China and the US lead the world when it comes to trading futures on soybeans. But how large are these markets, and which one is larger?
Standard volume measures are based on the number of contracts traded on exchanges, but that can be misleading. Chinese exchanges tend to have smaller contract sizes than US exchanges in terms of the underlying amount of the physical commodity. That means it takes more contracts to cover a comparable amount of risk.
An alternative approach is to convert trading volume into equivalent amounts by multiplying the number of contracts by the metric tons that each contract represents. This approach generates an "apples to apples" comparison of market size and provides insight into how much risk is traded through the Chinese markets compared to their counterparts in the US.
Applying this approach to futures on soybeans, soy meal and soy oil leads to some interesting comparisons. The soy complex is one of the pillars of the global agricultural derivatives markets, and many firms in the food supply chain look to these markets for price discovery and risk management.
China's soy futures are listed on the Dalian Commodity Exchange, which is located in the northeastern part of the country. DCE has listed soybean futures since 2002, but currently most of its trading volume is concentrated in futures on soy meal, which is mainly used in the production of animal feed, and futures on soy oil, which is mainly used as a cooking oil.
In the first half of 2021, more than 346 million soy futures changed hands on the Dalian exchange. Of that amount, 203 million was in soy meal futures, 110 million was in soy oil futures, and 33 million was in soybean futures.
The leading market in the US is the Chicago Board of Trade, a division of CME Group. The CBOT is the main benchmark for the global soy industry, but in recent years its volume has been eclipsed by the DCE, at least in terms of the number of contracts traded.
In the first half of 2021, Dalian traded more than 15 times the amount of soy meal futures, more than six times the amount of soy oil futures, and about the same amount of soybean futures.
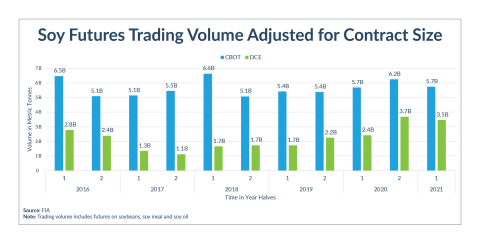
The relative size of these two markets looks quite different, however, when contract size is taken into account. Across all futures contracts, Dalian's volume was equivalent to 3.46 billion metric tons in the first half of 2021. The CBOT's trading volume during the same period was 5.74 billion metric tons. In other words, after adjusting for size, Dalian’s volume came out to just 60% of CBOT's volume. Still quite large, but a long way from matching the Chicago market.
There is another important dimension of market size – open interest, which consists of the sum of the outstanding positions at a certain point of time. Open interest is generally interpreted as a measure of the amount of risk that market participants are holding at that point in time, either to hedge their risks or to speculate on the direction of prices.
At the end of June 2021, Dalian’s soy complex held 2.96 million futures contracts outstanding. Meanwhile, CBOT’s soy complex held 1.56 million futures contracts outstanding. Comparing the two, Dalian has almost twice as much open interest as the CBOT in terms of the number of contracts.
After adjusting for size, however, their relative size is reversed. At the end of June 2021, Dalian’s soy futures complex held 29.55 billion metric tons outstanding. At the end of the same month, CBOT’s soy futures complex held 141.72 billion metric tons outstanding. In other words, Dalian has only 21% the open interest that CBOT holds in terms of metric ton equivalents.
In summary, the DCE's soy complex has become a significant center for trading activity, even after adjusting for the smaller size of its contracts, but the CBOT remains the most important center for this sector of the agricultural derivatives markets. In comparison to the CBOT, the DCE has roughly 60% of the volume and 21% of the open interest, measured in metric ton equivalents.
It is important to note that the CBOT is a much older and more established market. The Chicago exchange launched its first soybean contract in 1936, and a large and diverse ecosystem of market participants and service providers has grown up around its soy complex.
It is also worth noting that CBOT's futures contracts benefit from the adjacent market in options on those futures contracts. The CBOT’s soy options market is about a quarter of the size of the futures market in terms of trading volume, and the two markets complement each other in ways that lead to higher trading activity. In contrast, the DCE launched its first options on futures in 2017, and though the volume of trading has grown steadily since then, its options market is far smaller.
Another key point is the difference in access. The CBOT is open to traders from all over the world, and its contracts serve as benchmarks for the global trade in soybeans. In fact, the CBOT estimates that 16% of its soybean futures volume during 2020 was executed during the Asian day, a sign of its popularity with clients in the Asia-Pacific region. The DCE, in contrast, is dominated by domestic market participants. Although the Chinese government has allowed futures exchanges to offer certain contracts directly to non-local traders, none of the soy contracts are in that category yet.
Chris Mendelson is a data analyst at FIA and oversees the collection and publication of FIA’s monthly volume and open interest statistics.
| Jan-Jun 2021 Volume | End June 2021 Open Interest | |
| CBOT | 60,720,295 | 1,558,952 |
| DCE | 346,290 | 2,955,286 |
| Above Measured in Number of Contracts | ||
| Jan-Jun 2021 Volume | End June 2021 Open Interest | |
| CBOT | 5,737,894,271 | 141,720,640 |
| DCE | 3,462,906,890 | 29,552,860 |
| Above Measured in Metric Ton Equivalents | ||
|
Note: Metric ton equivalents were calculated by multiplying the number of contracts by the number of metric tons each contract represents. The DCE contracts are based on 10 metric tons. The CBOT soybean, soybean meal, and soybean oil contracts are based on 136, 90.7, and 27 metric tons, respectively. |
||