From a trading volume perspective, March was an exceptionally good month for the U.S. equity options markets. As the U.S. economy ground to a halt and the stock market plunged, the total number of options cleared by the OCC reached 662.8 million, smashing the record set only one month before.
But what about market quality? Did the options markets stay as liquid and accessible during this period of turmoil as they had been before the crisis? By some measures, the answer is no.
According to an analysis of market data by the research department at NYSE, the coronavirus harmed market quality in at least two ways: first, by disrupting a small but important subset of order flow executed on exchange-operated trading floors, and second, by causing market-makers to widen their bid-ask spreads, thus increasing the cost of trading.
In other respects, however, market quality has proven resilient. The NYSE analysis shows that some of the order flow displaced from trading floors was executed by other means. Also, even though bid-ask spreads widened, the amount of liquidity provided by market makers was almost exactly the same in notional terms.
More generally, the industry's ability to absorb record-setting amounts of trading volume three months in a row highlights the resiliency of the U.S. options markets, commented Ivan Brown, head of options at NYSE.
"January had been the highest month in ADV [average daily volume] terms until February, which was the highest ADV month in all time until March," Brown said in an interview with MarketVoice. "So the fact that the industry was able to handle this massive increase in volume and message traffic, and do so with a high level of resiliency, is a good narrative in terms of the collective investment that the industry has made."
Measuring the impact of trading floor closures
Last fall, U.S. options exchanges implemented a new set of codes that track the different types of trading supported by the industry. The NYSE analysis took advantage of this new source of market data to measure exactly how much disruption was caused by the closure of trading floors in the second half of March.
Although most customers transitioned long ago to electronic trading, four exchanges still run trading floors where options can be traded via open outcry: Cboe and Box in Chicago, Nasdaq in Philadelphia, and NYSE's Amex and Arca venues in New York and San Francisco. The exchanges say these floors continue to provide a more efficient method of execution for certain types of trades, primarily very large or complex orders that benefit from extended negotiation and human judgment.
That ended abruptly when the industry adopted measures to contain the spread of the coronavirus. Starting with Cboe on March 16, all of the exchanges closed their floors and shifted to all-electronic trading.
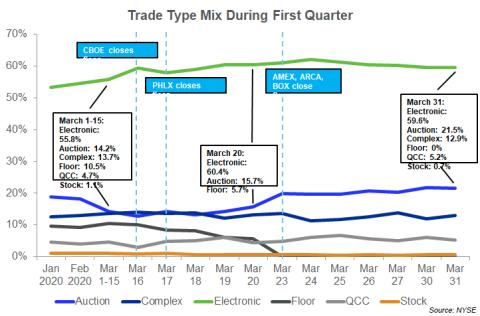
James Chu, a former options trader who now works for the NYSE research department, analyzed the trade type data for multiple-listed options across all U.S. exchanges. In a blog post published on April 8, he estimated that 10.5% of average daily volume was executed through those floors during the first half of the month. By March 20, that had dropped to 5.7%, and by month end it had dropped to zero.
Electronic trading picked up some of the slack, but not all. Trading through central limit order books rose almost four percentage points, from 55.8% in the first half of the month to 59.6% at the end of the month. Electronic auction mechanisms such as PIXL at Nasdaq and CUBE at NYSE Amex rose by more than seven percentage points, from 14.2% to 21.5%. But the total amount of trading dropped by more than 5 million contracts per day, from an average of 28.5 million per day in the first three weeks to 23.3 million in the final week of March.
How much of that decline was due to the closure of the trading floors is hard to determine. Brown told MarketVoice that other factors were impacting the market at the same time. The Cboe Volatility Index, the industry benchmark for equity market volatility, was substantially lower in the last week of the month. Second, the widespread implementation of work-from-home policies made it more difficult to execute certain types of "high-touch" strategies normally handled through the trading desks at banks and brokers.
Even harder to determine is how much of that trading will come back to the floors when the pandemic comes to an end and large gatherings resume. The uptick in electronic auction volume suggests that this method has been the most popular alternative to floor trading, rather than complex order books or plain vanilla electronic trading. Once market participants become accustomed to this method of trading, some may stick with the new rather than return to the old. Thanks to the new data on trading types, it will become possible to measure the ongoing change in behavior with much greater precision.
Trading costs rose, but quoted size remained constant
The NYSE analysis also looked at several measures of market quality. Using data for the top 15% most active symbols, which account for 95% of all volume in multiply listed options, Chu analyzed changes in bid-ask spreads and posted size to assess the impact of the pandemic.
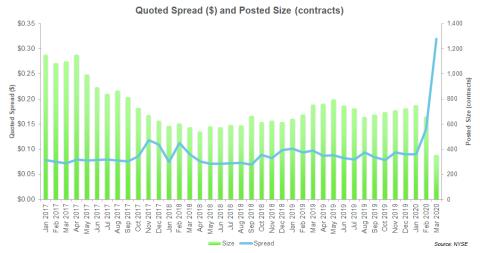
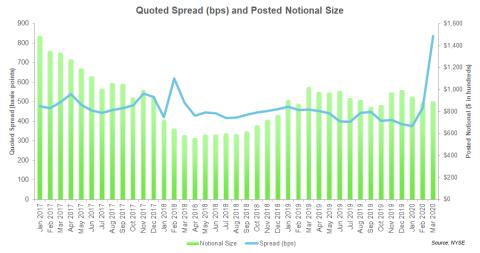
Measured in dollars, the average bid-ask spread shot up from 9 cents in January to 32 cents in March, an increase of 256%. Measured in basis points, which adjusts for variations in the size of the underlying stocks, the average spread rose 123%. By either standard, bid-ask spreads widened dramatically. In January, they were near the lowest level in three years. Two months later, they were at the highest level in three years.
Why the dramatic reversal? According to Chu, it was not so much the size of the increase in volatility but rather the speed of the increase. The stock market not only fell during the first quarter, it fell extremely rapidly. In fact, the amount of time it took for the U.S. stock market to transition from bull to bear was the fastest in history, according to Chu. That confirmed what he has seen in past episodes of increased volatility: the speed at which volatility changes—what traders call the "vol of vol"—tends to have the largest impact on market quality.
Another way to measure market quality is to look at posted size, which represents the amount of liquidity that market makers are willing to display as available for trading in the exchanges' central limit order books.
Measured by the number of contracts, posted size fell dramatically as the pandemic took hold. Average posted size fell from 752 contracts per side in January to 354 in March, a decline of 54%, according to Chu's analysis. In other words, the order book shrank by more than half as market makers pulled back. But Chu cautioned that this measure does not tell the full story because it does not consider the changes in options prices. The average price of options roughly doubled from January to March, and after adjusting for that change, the notional value of posted size remained "relatively stable" throughout the quarter, according to Chu. He estimated that the average posted size in notional terms was $89,200 per side in March, down just 4.7% from $93,600 in January.
In other words, market makers widened their quotes to manage their exposure to adverse price movements, but they did not reduce the amount of liquidity they were willing to provide to the market. "Market-makers were still willing to place their bets, but they widened spreads in order to still play with the same amount of money," Chu told MarketVoice.