ETD Tracker
Insights on volume and open interest in the global futures and options markets
Volume by Year
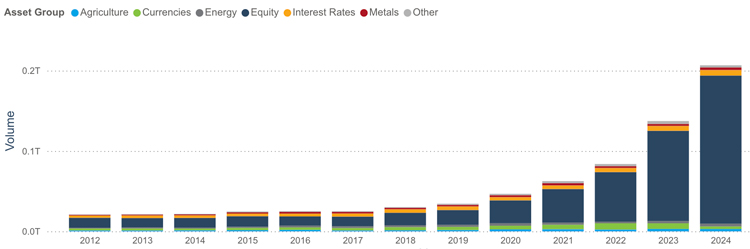
The ETD Tracker provides insights on trends in the trading of futures and options on exchanges worldwide. The ETD Tracker consists of interactive visualizations that allow users to view data on volume and open interest, with filters based on year and month, region and jurisdiction, asset group and type of product.
Access NowCCP Tracker
Quarterly data on risk exposures at derivatives clearinghouses
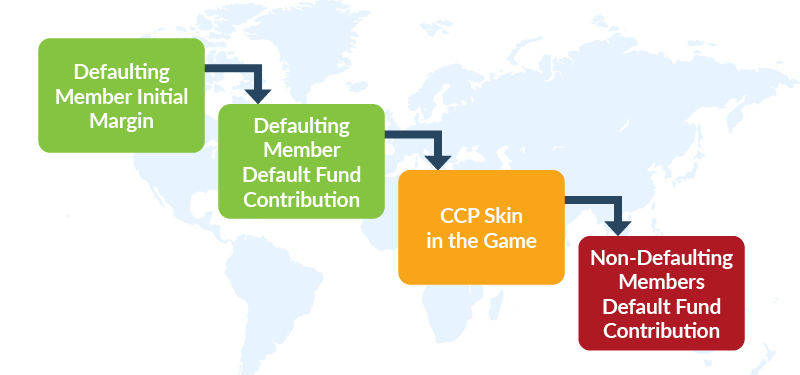
The CCP Tracker is designed to provide greater transparency into the amount of risk in the global clearing system and the financial resources available to protect the system from losses. Using the public quantitative disclosures published by derivatives clearinghouses on a quarterly basis, the CCP Tracker contains a set of charts and tables that allow users to compare several key metrics for each quarter going back to the second half of 2015.
Access NowFCM Tracker
Monthly data on customer funds held at U.S. futures commission merchants
Customer Seg Funds in Futures Accounts and FCM Count over Time
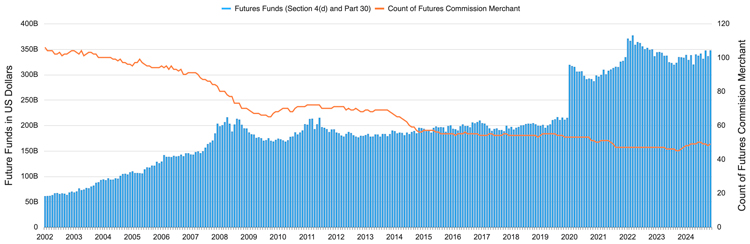
The visualizations show the level of customer segregated funds held by FCMs as well as the number of FCMs holding those funds. The visualizations also include a table showing the amount of customer funds held by each FCM and the percent change over time, and a special "lookup" page that displays key data points for individual FCMs. Sign up to receive monthly alerts.
Access NowRecent Articles & Analysis
-
May 2025 stats on customer funds held at US FCMs
The total amount of customer funds in futures accounts at US FCMs reached a $390 billion in May, down 0.1% from the previous month but up 15.6% over the last 12 months. The number of FCMs holding customer funds in futures accounts was recorded at 50 in May, up from 49 year ago but down from 53 five years ago.
CONTINUE READING -
CCP Tracker update - Q1 2025 highlights
FIA has updated its CCP Tracker visualizations with data from the first quarter.
CONTINUE READING -
ETD Volume - May 2025
Worldwide volume of exchange-traded derivatives reached 8.82 billion contracts in May. This was down 7.9% from April 2025 and down 51.1% from May 2024.
CONTINUE READING -
April 2025 stats on customer funds held at US FCMs
The total amount of customer funds in futures accounts at US FCMs reached a record setting $390.4 billion in April, up 11.3% from the previous month and up 19.1% over the last 12 months. The number of FCMs holding customer funds in futures accounts was recorded at 50 in April, up from 48 year ago but down from 53 five years ago.
CONTINUE READING
Data Webinars
2024 Annual ETD Volume Review
past webinar
Trading volume in the global exchange-traded derivatives markets is on track to another record for the sixth year in a row. Join us for a discussion with Michael du Plessis and Alex Grinfeld of Liquidnet on the trends that are driving up volume and open interest across interest rate, equity and commodity futures and options.
Download PresentationTrends in ETD Trading Q3 2024
past webinar
FIA’s quarterly review of volume and open interest on derivatives exchanges worldwide. This webinar will provide insights into trends in trading activity in the global listed derivatives markets for the year to date. Areas of focus will include equity index derivatives in India, the US and Europe, interest rate futures and options in the US and Europe, and commodity futures and options in Europe, APAC and the US.
Download PresentationQ2 2024 ETD Volume Trends
past webinar
FIA’s quarterly review of volume and open interest on derivatives exchanges worldwide. This webinar will provide insights into trends in trading activity in the global listed derivatives markets. Areas of focus will include equity index derivatives in India, the US and Europe, interest rate futures and options in the US and Europe, and the changing composition of the global markets for commodity futures and options. This quarter’s guest speakers will be Scott Klipper, a portfolio manager for GreshamQuant, the systematic arm of Gresham Investment Management.
Download PresentationQ1 2024 ETD Volume Trends
past webinar
FIA’s quarterly review of volume and open interest on derivatives exchanges worldwide. This webinar provides insights into trends in trading activity in the global listed derivatives markets. Areas of focus include equity index derivatives in India, the US and Europe, interest rate futures and options in the US and Europe, and the changing composition of the global markets for commodity futures and options. This quarter’s guest speakers are Davesh Dubal, EMEA Head Electronic Trading for ETD and FX, UBS, and Giovanni Martelli, Head of EMEA ETD Voice Execution, UBS.
Download Presentation