Global Futures and Options Volume Reaches Record Level
Global futures and options volume rose to a record level in 2016, but beneath the headline number there was considerable variation. Futures volume grew for the fifth year in a row but options volume sunk to its lowest level since 2007. Trading activity was up in North America, Europe and Latin America but down in Asia-Pacific. There was strong growth in commodity futures and options and interest rate volume hit its highest level since 2007, but the equity sector continued its downward trend.
The total number of futures and options traded on exchanges worldwide reached 25.22 billion contracts in 2016. Although that was only 1.7% higher than the previous year, the increase in the number of contracts traded was enough to set a new annual record for the derivatives exchange industry. The previous high was set in 2011, when total volume reached 24.98 billion.
Download the full FIA 2016 Volume Survey from Resources on the right.
The regional breakdown of this year's trading activity followed a very different pattern from 2015, when exchanges in Asia-Pacific were the main engine of growth. In 2016, trading activity on North American exchanges was up 4.8% to 8.59 billion contracts, Europe was up 8.0% to 5.18 billion, and Latin America was up 11.3% to 1.62 billion. In fact, both North America and Europe set records in terms of the total amount of trading in those regions. In contrast, volume in Asia-Pacific fell 5.3% to 9.18 billion. Asia-Pacific still accounts for more volume than any other region, but its share of the global total fell from 39% to 36%.
What caused this reversal of regional trends? The answer emerges quite clearly if we split the volume by product types and look at futures and options separately. Trading of futures has been growing steadily in all regions and hit a record of 15.89 billion contracts in 2016. In contrast, options trading has been declining since 2011. In 2016, the total number of options contracts traded on exchanges was 9.33 billion, down 9.6% from the previous year and down 27.3% from 2011. In fact, the 9.33 billion options traded in 2016 was the lowest annual amount since 2007.
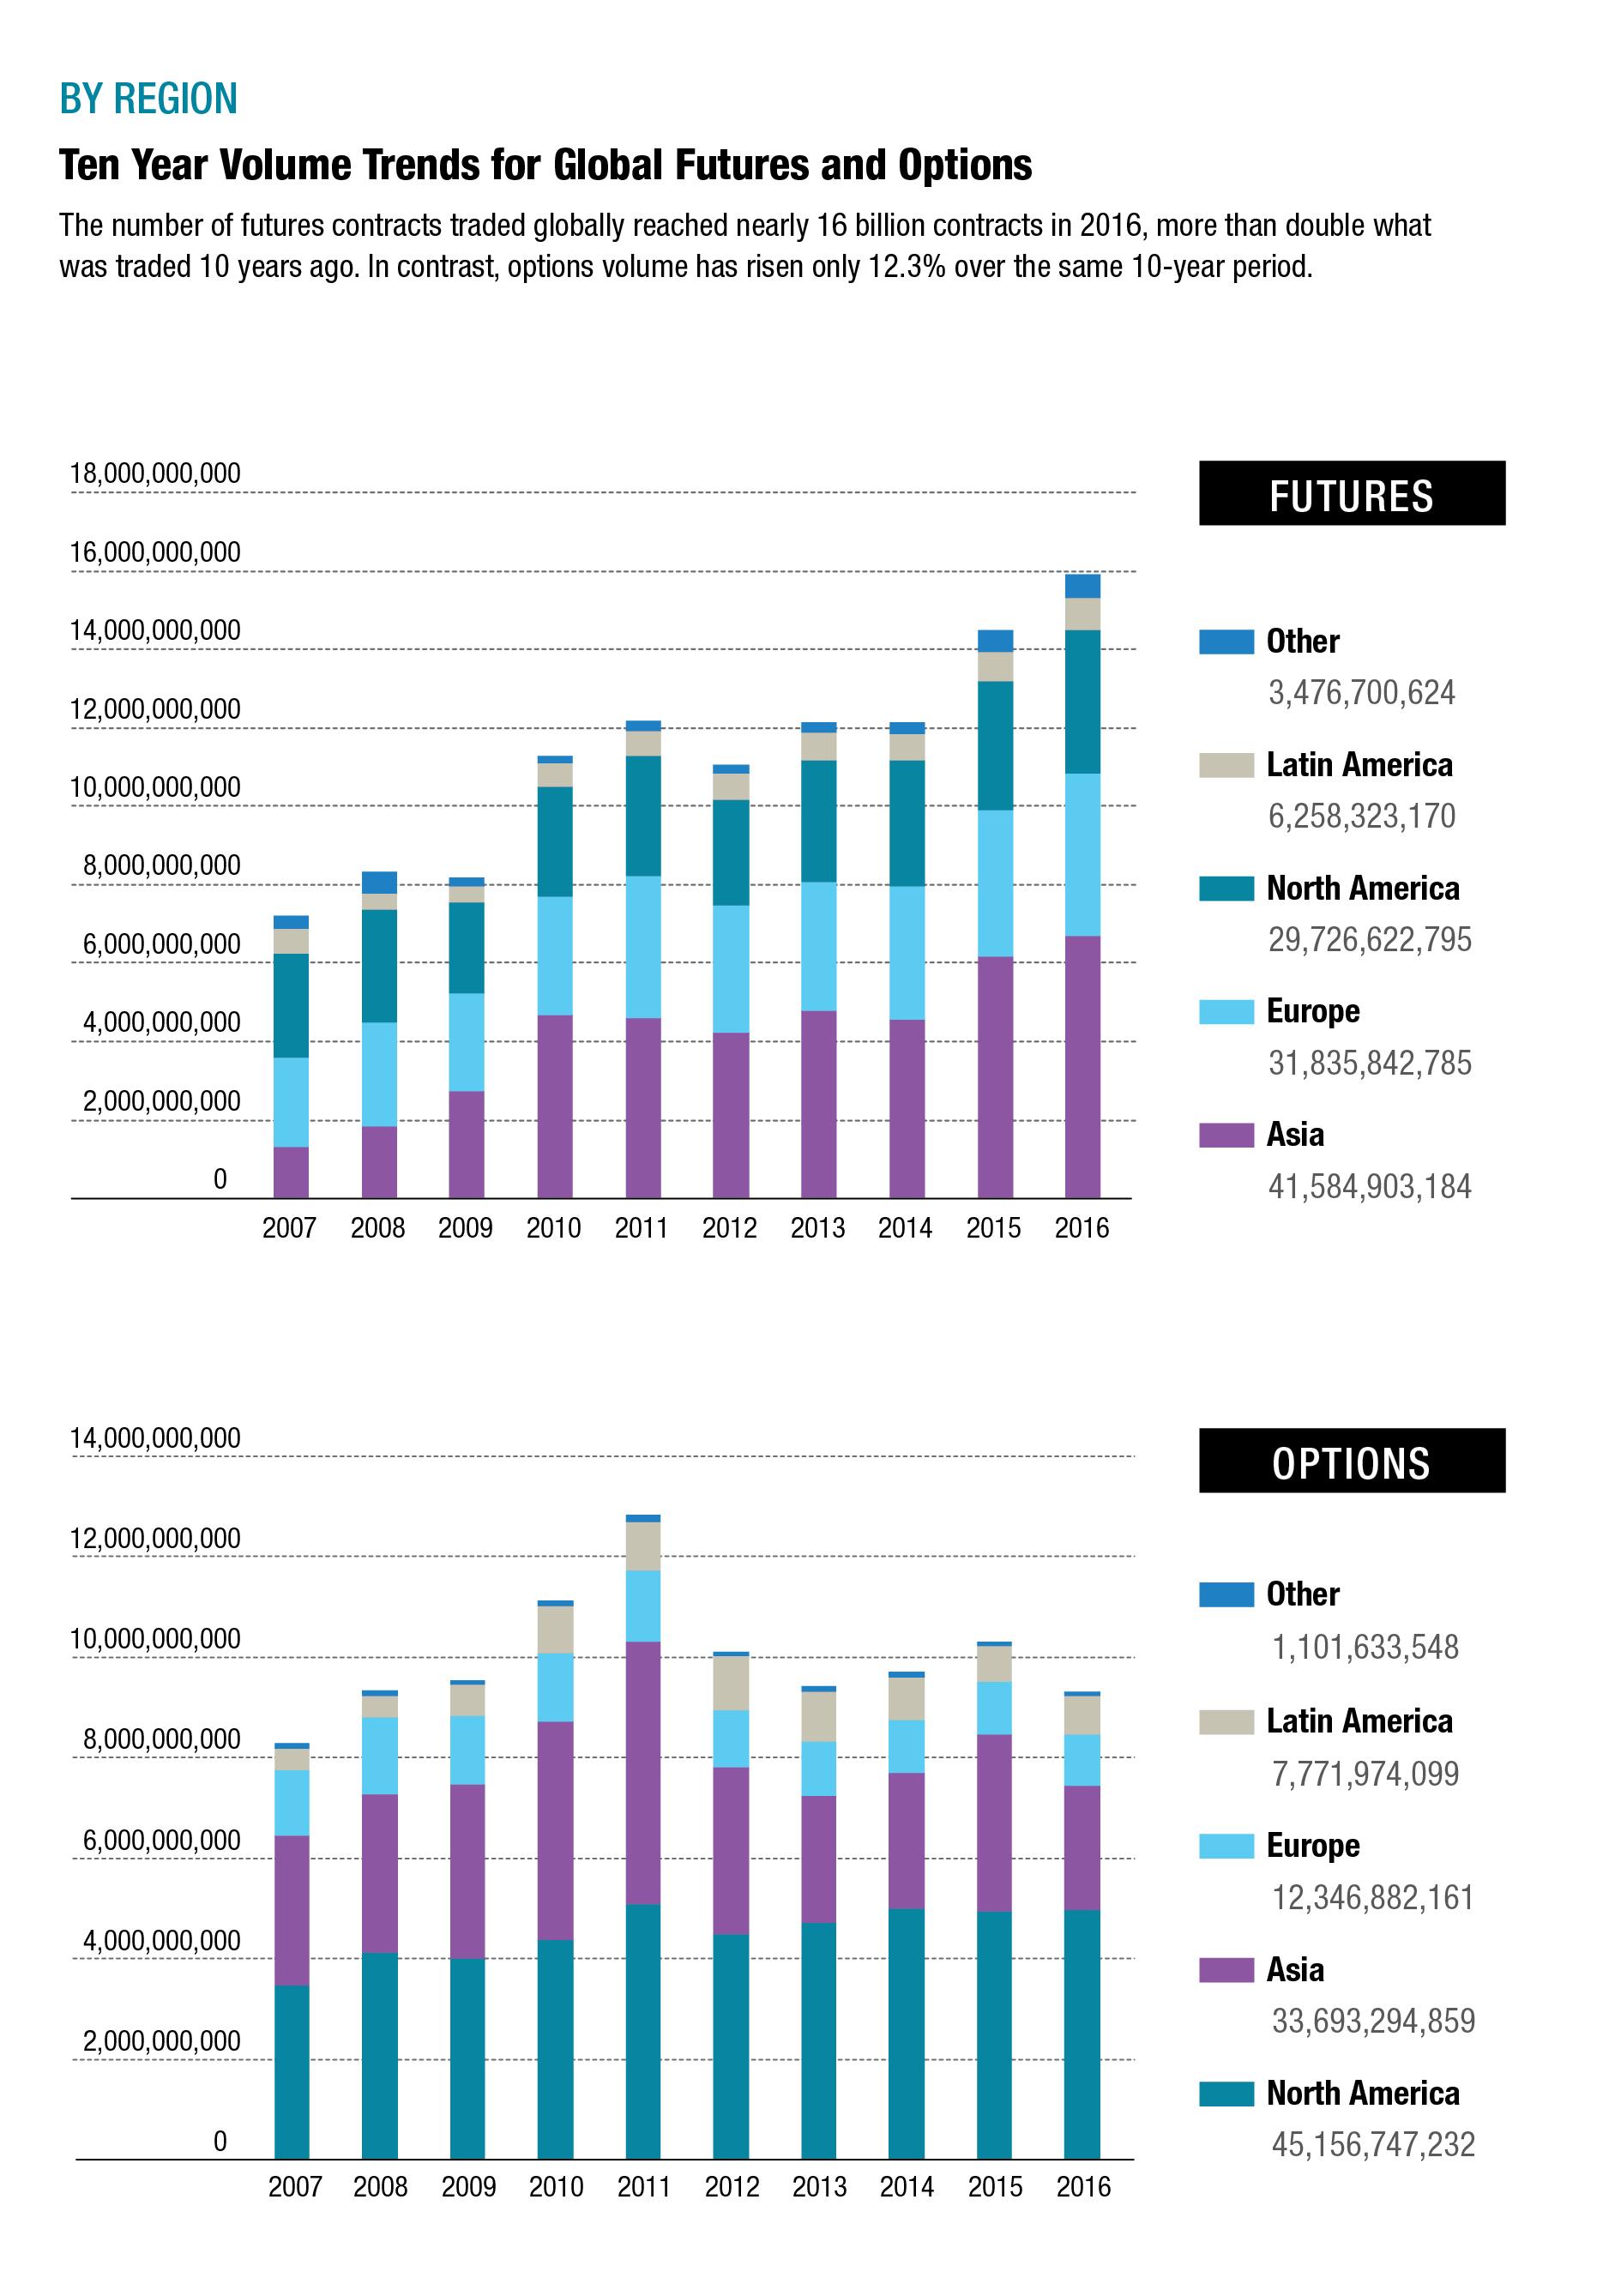
The downtrend in options trading was especially pronounced in Asia-Pacific. The total number of options contracts traded on exchanges in that region fell 29.6% in 2016 to 2.48 billion, the lowest level for that region in 10 years. But the downtrend was not limited to that region. Options volume in North America and Europe has been essentially unchanged over the past several years, and both of those two regions are well below the peaks they set in 2011.
Clearly the futures side of the exchange-traded derivatives industry is doing better than the options side. The main reason is that options volume is more heavily weighted to equities, which has been in a downtrend since 2011. Options based on equity indices and individual equities accounted for 83.4% of all options volume in 2016. From 2007 to 2011, these products grew rapidly, but since then they have been in decline, and the level of volume in 2016 was roughly the same as it was in 2007. Futures volume on the other hand is more diversified in terms of categories and has benefitted from strong growth in other sectors of the market such as commodities and currencies.
CATEGORIES
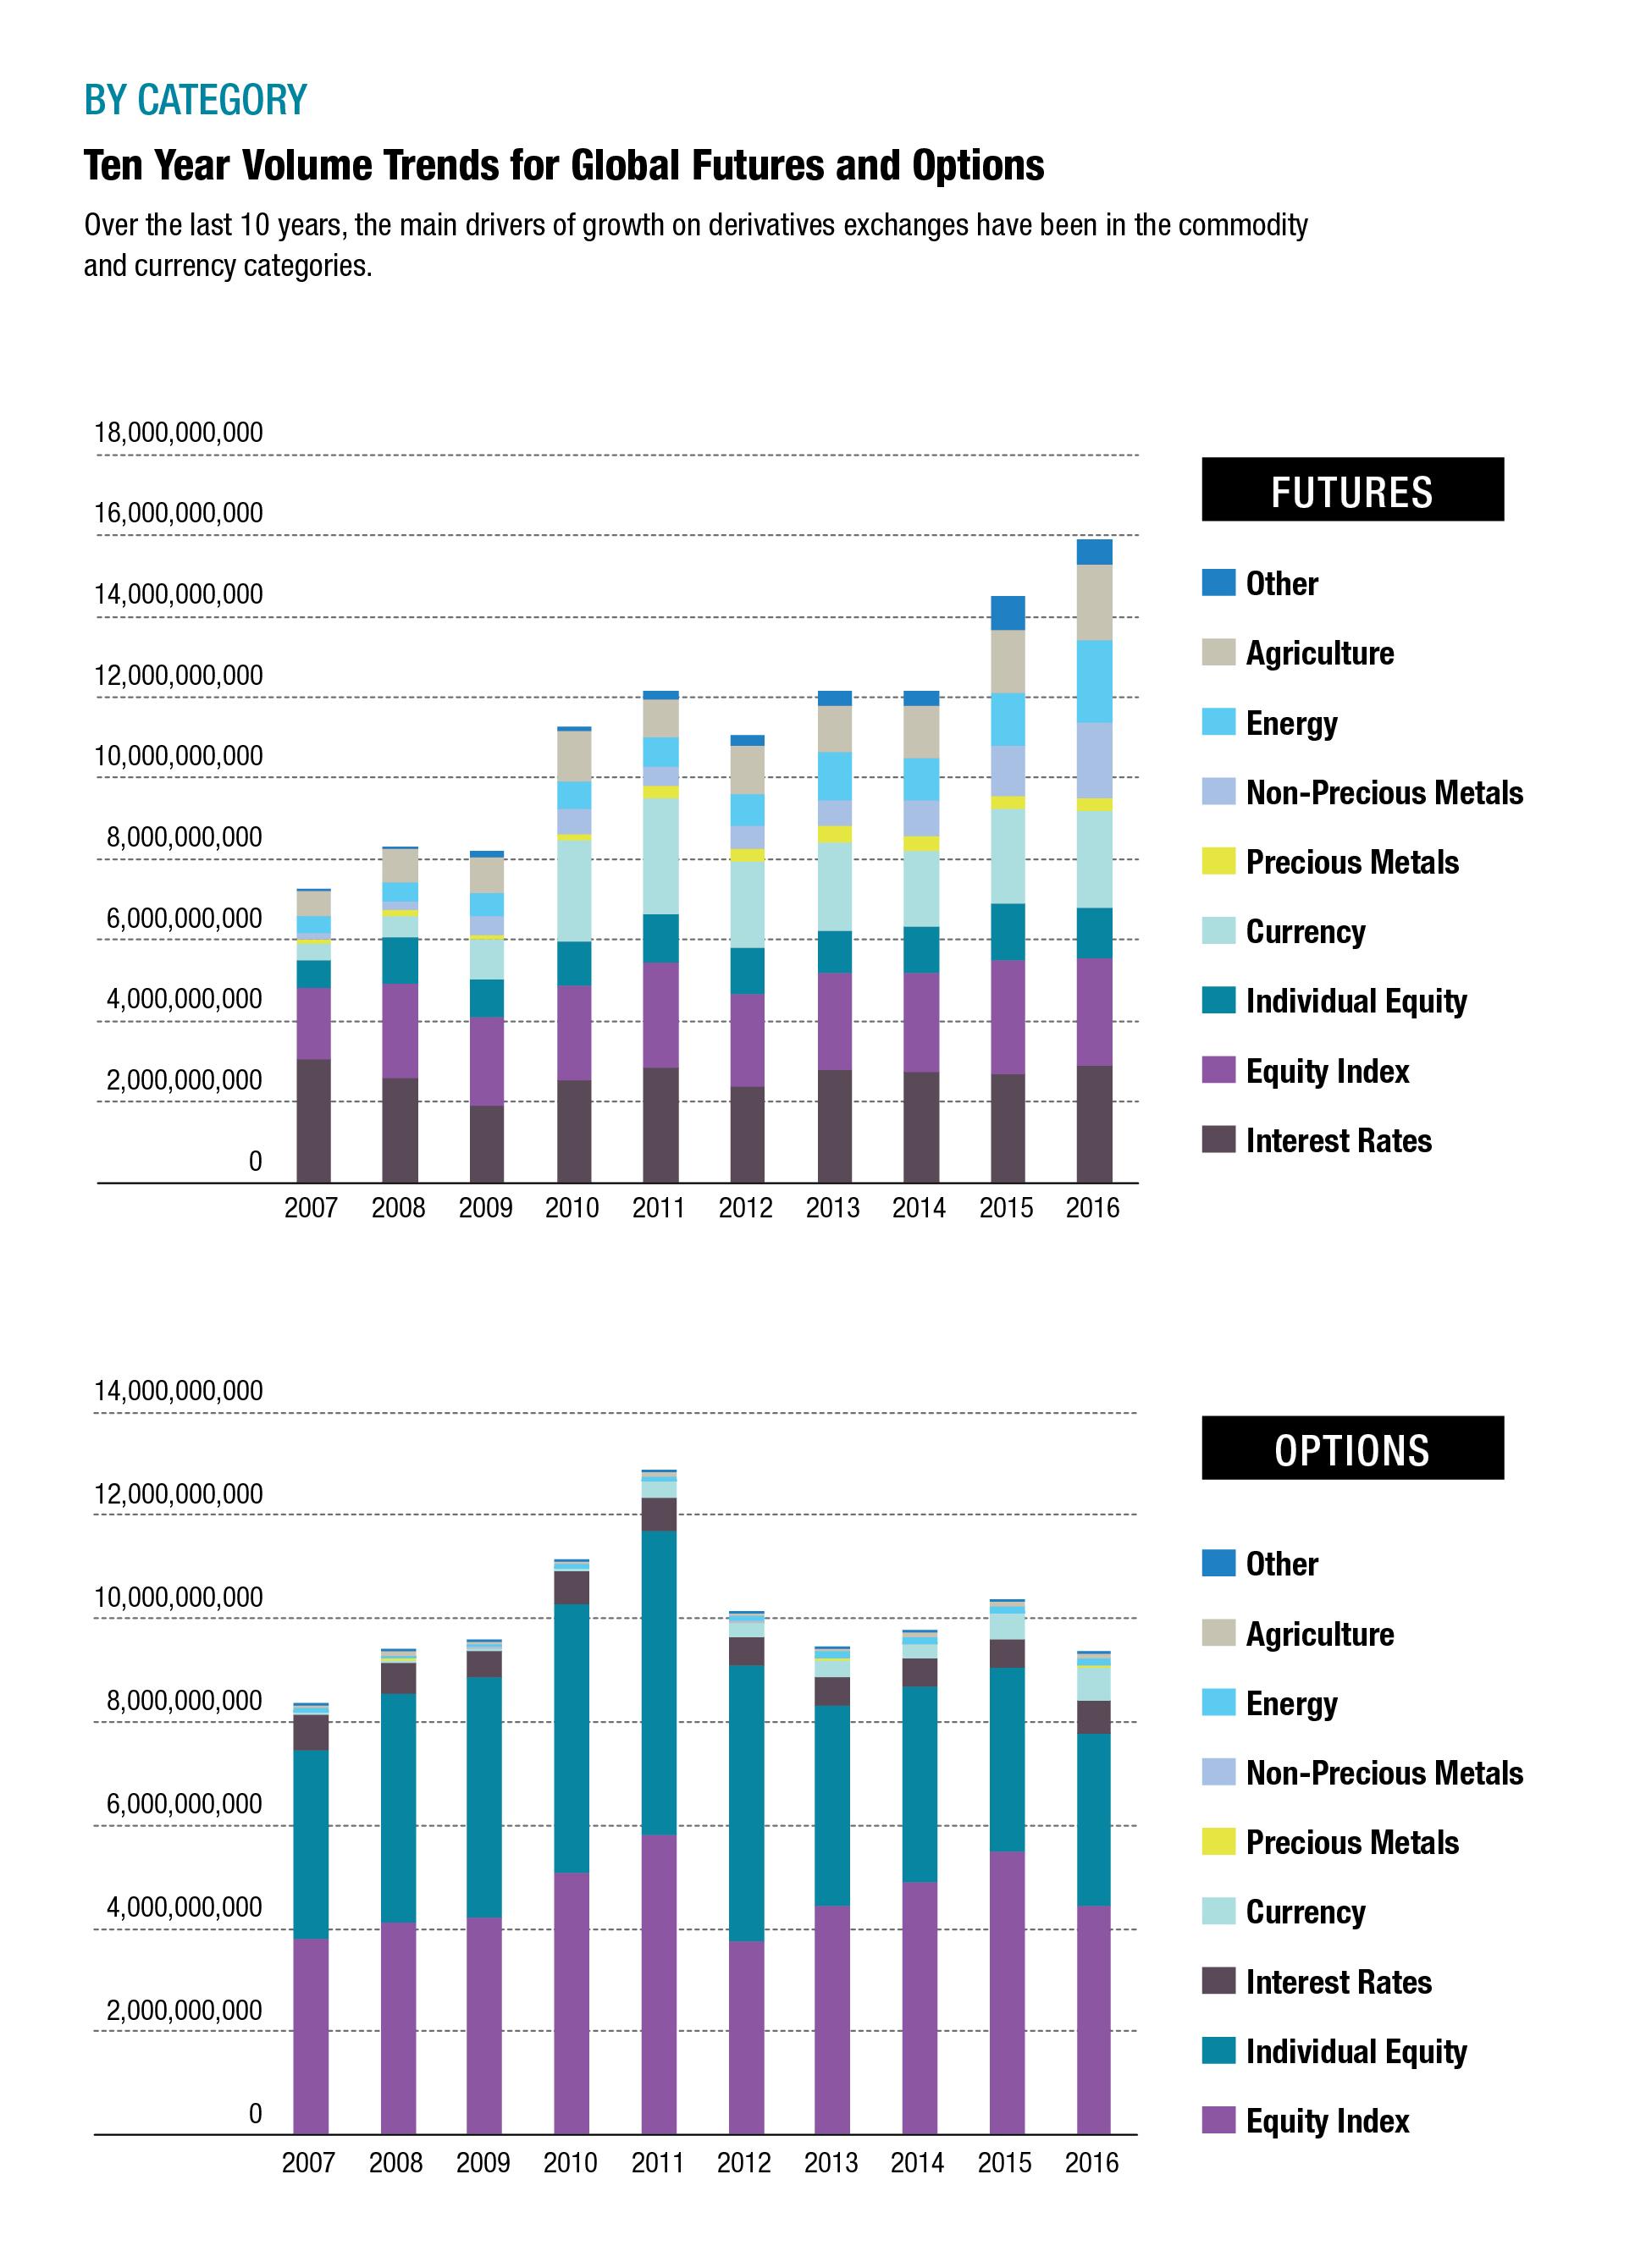
Given this difference between the two types of products, it makes sense to look the category-level trends separately. Let's start with futures. If we look at the volume trends for futures in each of the seven categories, two trends quickly become clear. First, in 2016 trading of interest rate futures rose 7.2% to 2.89 billion contracts. That was not a record, but it was the highest amount of trading since 2007, when 3.08 billion interest rate futures changed hands.
Second, the trading of futures on three types of physical commodities has been growing very rapidly for the past 10 years. From 2007 to 2016, the number of contracts traded in the agricultural, energy and non-precious metals categories rose from 1.16 billion to 5.77 billion.
In 2016, interest rate futures rose 7.2%.
Meanwhile the equity index and individual equity categories were trending downward. Equity index futures fell 5.9% to 2.67 billion, and individual equity futures fell 12.6% to 1.23 billion. But unlike the options side of the industry, these products accounted for only 24.5% of total futures volume in 2016. As a result, the lack of growth in that sector was more than offset by the growth in futures on interest rates and commodities.
Now let's look at what happened with options. As mentioned above, the two categories in the equity sector were both down. Equity index options volume fell 19.2% to 4.45 billion, roughly the same level as 2013. Individual equity options volume declined 5.9% to 3.33 billion, the lowest level in more than 10 years. Other types of options were more actively traded in 2016, however. The number of currency options traded on exchanges jumped 39.1% to 655.3 million contracts, interest rate options rose 11.5% to 632.5 million contracts, the highest since 2011, and options on agricultural commodities, energy and non-precious metals all increased. But these gains were not enough to offset the decline in the equity sector.
EXCHANGES
Turning to the exchange-centric perspective on trading volumes, let's look at which exchanges were up and which were down. Total volume at CME Group, the largest exchange in the world by trading volume, rose to 3.94 billion contracts, up 11.6% from the previous year. Many of its flagship contracts had substantial jumps in trading activity. Eurodollar futures rose 11.6% to 654.9 million contracts, E-mini S&P 500 futures rose 10.0% to 472.7 million, 10-year Treasury note futures increased 6.8% to 350.8 million, WTI crude oil futures jumped 36.9% to 276.8 million contracts, and Henry Hub natural gas futures surged 19.2% to 97.5 million.
The uptick in the Eurodollar market is especially noteworthy because of its size and importance to the industry. Eurodollar futures volume, which declined from 2014 to 2015, rebounded to 654.9 million contracts in 2016, an increase of 11.6%. Euro-dollar options, which have exploded in popularity in recent years, jumped 49.9% in 2016 to 168.3 million and mid-curve Eurodollar options, which are based on long-dated Eurodollar futures, rose 7.0% to 140.5 million. On a combined basis, volume across the entire Eurodollar complex reached 963.7 million contracts in 2016. That was an increase of 133.2 million contracts from the previous year, which was equivalent to a growth rate of 16%.
On a combined basis, volume across the entire Eurodollar complex reached 963.7 million contracts in 2016.
The National Stock Exchange of India, number two on our list, travelled in the opposite direction. Total volume on this exchange fell 30.1% to 2.12 billion, mostly due to a collapse in its equity index products. The CNX Nifty index options, its most actively traded contract, sank 59.5% to 715.3 million, and the CNX Nifty index futures plunged 62.3% to 48.6 million contracts. Single stock futures fell 32.9% to 172.7 million, and single stock options declined 15.0% to 88.8 million.
Intercontinental Exchange, number three on our list, had essentially the same amount of trading in 2016 as it had in the previous year. Trading activity on its futures exchange in London was boosted by higher trading of its Brent crude oil futures and short term interest rate products, but trading activity in its equity options business in the U.S. was down 5.6%.
Rounding out the top five were Moscow Exchange, up 17.5% to 1.95 billion contracts, and Eurex, up 3.3% to 1.73 billion contracts. The fact that the Russian exchange is now larger than Eurex based on the number of contracts traded may come as a surprise to many people in the market, given that Eurex has been the largest exchange in Europe for many years. And it should be noted that many of the Russian exchange's most heavily traded contracts are much smaller than their equivalents in Western Europe or the U.S. But there is no question that the two exchanges have been on very different trend lines in recent years. Since 2011, Moscow Exchange's volume has risen by 77%, while Eurex' volume has decreased by 15.4%.
One example of that growth is the Brent oil futures contract traded on MOEX. Its price tracks the Brent oil futures traded in London on ICE Futures Europe, but the contract size is based on just 10 barrels, compared to 1,000 for the ICE contract. That makes the contract more accessible to retail traders, but somewhat less suitable for corporate entities looking to hedge price risk. This is reflected in the open interest data. At year-end 2016, open interest for the MOEX Brent crude oil contract was approximately 450,000 contracts, while open interest in the ICE Brent crude oil futures was more than four times that amount at 2.18 million contracts.
Another example of the Russian exchange's growth is its currency contracts, and especially its U.S. dollar/ Russian ruble futures. This is by far the exchange's most actively traded contract, and it has become an important international benchmark for pricing the Russian currency. In 2016, more than 860.1 million of these futures traded on MOEX, down 4.8% from the previous year but more than double the total number traded in 2013. The growth of this contract prompted the Emerging Markets Traders Association in mid-2016 to recommend the MOEX benchmark as the main reference rate for ruble derivatives in the over-the-counter foreign exchange market, and CME Group now uses this benchmark for its ruble-denominated currency futures.
Meanwhile at Eurex, the growth trends in the benchmark products were mixed. Euro Stoxx 50 stock index futures rose 9.5% to 374.5 million contracts, but Euro Stoxx 50 index options declined 4.5% to 286.3 million. Euro bund futures increased 5.4% to 186.7 million, but Euro Bund options fell 23.1% to 34.9 million.
On the other hand, some of the exchange's more narrowly targeted contracts attracted significant interest. For example, the futures on the Euro Stoxx Banks index, which tracks the 10 European banks in the Euro Stoxx index, jumped 76.5% to 42.7 million, while the options on this sector index shot up 154.0% to 27.7 million. The expansion of its interest rate complex to include futures on Italian and French government debt is also paying dividends. The trading volume in its Euro BTP futures and Euro OAT futures have been rising steadily over the last three years and reached 28.3 million and 29.0 million contracts in 2016, respectively.
Looking at the rest of the exchange table, the Chinese exchanges stand out because of the size of their markets but also because of their contrasting fortunes. The trading of financial futures shrank to just a fraction of its former size, mainly due to the government's efforts to crack down on excessive speculation in the stock market. The China Financial Futures Exchange, the only exchange in mainland China that offers financial futures, suffered a 95% decline in its volume, which fell from 321.6 million contracts in 2015 to just 18.3 million in 2016. The trading of commodity futures, on the other hand, continues to rise rapidly. Trading on the Shanghai Futures Exchange rose 60.0% to 1.68 billion contracts, making it the sixth largest exchange in the world, while trading on the Dalian Commodity Exchange rose 37.7% to 1.54 billion contracts, eighth in the world.
Two other exchanges worth noting are BATS and CBOE, which in September announced an agreement to merge. The number of derivatives contracts traded on the two exchanges reached 1.63 billion in 2016, and the combined entity would rank as the seventh largest derivatives exchange in the world, right above Nasdaq.
Four smaller exchanges that had exceptional growth in 2016 were Argentina's Rosario Futures Exchange, Turkey's Borsa Istanbul, the Thailand Futures Exchange, and the Dubai Gold and Commodities Exchange. Trading activity at Rofex soared 53.5% to 113.4 million, mainly due to an explosion in the trading of its U.S. dollar futures. Borsa Istanbul's volume reached 107.3 million, up 20.7% from the previous year, with strong growth across a range of contracts. The Thailand Futures Exchange surged 43.3% to 69.6 million contracts, thanks to a boom in the number of single stock futures traded on the exchange. DGCX jumped 35.6% to 19.7 million due to increased trading in its currency contracts.
FIVE YEAR PERSPECTIVE
Earlier in this article we noted that 2011 marked a peak for options volume, and that options trading since then has been trending downward. One of the main reasons for this was the sharp decline in options trading on several Asian exchanges. Korea Exchange, for example, traded 3.93 billion contracts in 2011, which at that time made it the largest exchange in the world, and its Kospi stock index options were a big part of that success. By 2016, the exchange's volume had fallen to 693.0 million. An other example was MCX-SX, now the Metropolitan Stock Exchange of India.
North America as a whole grew 4.9% from 8.19 billion in 2011 to 8.59 billion contracts in 2016.
That exchange's volume went from 850.0 million in 2011 to just 46.8 million in 2016. Some Asian exchanges grew over this time period, notably Japan Exchange and Taiwan Futures Exchange. But Asian exchanges overall fell from 9.83 billion in 2011 to 9.18 billion in 2016, a decline of 6.6%. In absolute terms, the number of contracts traded fell by 645.2 million, which is roughly equivalent to the amount of trading on the New York Mercantile Exchange. Contrast that with the growth trend in North America. Over the same five-year period, CME Group volume rose 16.2% to 3.94 billion. In absolute terms, the number of contracts traded on CME increased by 548.6 million. ICE Futures U.S., although much smaller, grew from 107.3 million to 370.2 million, an increase of 245% or 262.9 million contracts. North America as a whole grew from 8.19 billion in 2011 to 8.59 billion, an increase of 4.9% or 403.4 million.
It should be noted, however, that all of that growth came from the futures side of the industry. Total trading of options on securities exchanges such as CBOE, NYSE and Nasdaq went from 4.56 billion in 2011 to 4.06 billion in 2016, a decline of 10.9%. In absolute terms, the decline was 499.5 million contracts. As noted above, this reflects the decline of trading activity in the equity sector in recent years.