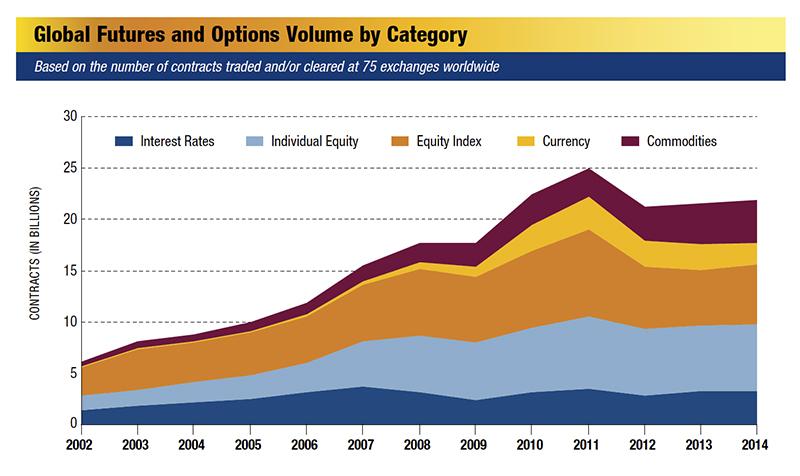
The number of futures and options traded on exchanges worldwide rose a slight 1.5% in 2014. Total volume was 21.87 billion contracts, up from 21.55 billion in 2013. While it was the second year in a row that volume increased, the level of trading was still well below 2011’s peak volume of 24.99 billion contracts.
North America continued to be the region with the greatest amount of growth. Exchanges in the U.S. and Canada reported 8.21 billion in volume, up from 7.83 billion in 2013 and 7.23 billion in 2012. Exchanges in Asia-Pacific, which account for about one-third of global volume, reported lower volume for the second year in a row. Trading in that region was 7.25 billion in 2014, down from 7.30 billion in 2013 and 7.53 billion in 2012. The European region fared slightly better, with volume reaching 4.45 billion in 2014, up from 4.36 billion in 2013 and 4.39 billion in 2012. Most of that growth came from exchanges outside the core markets in Western Europe, however.
In terms of categories, trading in equity index futures and options showed the most increase. Volume in this category rose 8.3% to 5.83 billion, equivalent to nearly 26.7% of the global market. Another hot area was agricultural future and options. Volume in this category rose 15.7% to 1.40 billion, equivalent to 6.4% of the global market. Currency trading moved in the opposite direction, falling 15.1% to 2.12 billion.
FIA’s statistics were gathered from 75 exchanges worldwide and include all futures and options that were traded or cleared by these exchanges. The data are based on the number of contracts traded, rather than their value. To reflect changes in exchange ownership that took place in 2014, FIA adjusted the 2013 data as if the changes had already happened.
Ups and downs among the exchanges
Looking at the results for the leading exchanges, the two main Chicago-based groups did well in 2014. CME Group volume rose 8.9% to 3.44 billion, with interest rate and equity index products accounting for most of the increase. CBOE Holdings volume rose 11.6% to 1.33 billion, with VIX futures and options playing an important role in that growth.
On the other hand, Intercontinental Exchange had a difficult year, with total volume across its European and North American exchanges falling 11.0% to 2.28 billion. Trading on its newly acquired U.S. options exchanges, NYSE Amex and NYSE Arca, shrank by 8.8%, while trading on its three futures exchanges, which now includes the interest rate futures and certain other contracts previously traded on Liffe, fell by 12.5%.
Eurex also reported a decline in trading, with group-wide volume declining 4.2% to 2.10 billion. Volume on ISE Gemini, the options exchange that Eurex launched in the U.S. in August 2013, grew very rapidly in 2014 but that did not fully offset the decline in volume elsewhere in the group. Volume at International Securities Exchange fell 20.7% to 481.3 million while volume at Eurex itself declined 4.0% to 1.49 billion.
In Asia, volume on the Shanghai Futures Exchange surged 31.1% to 842.3 million, driven by strong growth in the trading of commodities such as steel rebar, zinc and aluminum. Volume on the China Financial Futures Exchange, also located in Shanghai, grew 12.4% to 217.6 million, with the majority of that volume in its CSI 300 futures contract. That contract is now the most actively traded stock index futures in the Asia-Pacific region. The Zhengzhou Commodity Exchange saw an increase in volume of 28.8% to 316.6 million contracts, driven by very strong growth in sugar, cotton and rapeseed meal futures.
Several exchanges in India suffered large decreases in trading volume. National Stock Exchange of India, the largest derivatives exchange in the country, had an 11.6% decrease in volume to 1.88 billion contracts, due mainly to decreased trading of its currency contracts. Trading at the Multi Commodity Exchange tumbled 49.5% to 133.8 million contracts, and the Metropolitan Stock Exchange of India, formerly known as MSX-SX, plunged 76.5% in volume to 124.3 million contracts. On the other hand, BSE, formerly known as the Bombay Stock Exchange, reported that 725.8 million contracts were traded in 2014, a 184.8% increase from the previous year.
Among the smaller exchanges, three stand out for exceptional growth. The Taiwan Futures Exchange reported 202.2 million in volume, up 32.0% from 2013, mainly due to increased trading of its equity index and single stock options. The Thailand Futures Exchange more than doubled its 2013 volume, rising to 36.0 million contracts traded due to the popularity of its SET 50 equity index futures and its single stock futures. The Miami International Securities Exchange, the newest entrant into the crowded U.S. equity options marketplace, reported 134.5 million in volume in 2014, its first full year as an exchange.
Drilling down to individual contracts
As mentioned above, the equity index category was one of the areas where volume grew significantly in 2014. A large part of this growth came from the U.S. options exchanges and India’s BSE.
Of the top 20 equity index contracts traded in the world, five were options on exchange-traded funds traded in the U.S. All five had higher volume in 2014, and two in particular had large increases in volume—the options on the iShares Russell 2000 ETF and the Powershares QQQ ETF. The ETF options trade on multiple exchanges and have become a popular way for both retail and institutional investors to express a view on the direction of the underlying index.
In the case of BSE, the exchange’s S&P Sensex index options took off in June, when the exchange introduced a new incentive scheme to encourage trading. From January through May, trading was at more or less the same level as 2013, but thereafter volumes soared. By year end, 439.1 million contracts had changed hands, compared to 108.6 million in 2013.
Among the benchmark equity index futures in Europe and the U.S., the Euro Stoxx futures and options traded at Eurex did relatively well. Volume in those contracts rose by 9.4% and 7.1%, respectively. Volume in the E-mini S&P 500 futures traded at CME declined 6.0% but trading in the S&P 500 options traded at CBOE rose by 7.9%. CBOE’s VIX options and futures continued their ascent, with volume rising by 11.4% and 26.5%, respectively.
Also worth noting in this category is the Kospi 200 options contract that trades on the Korea Exchange. Volume in this contract, which at one point was the world’s most actively traded derivative, fell by 20.4% in 2014. The contract has been falling down the volume tables for several years, following a five-fold increase in the size of the contract in 2012 and other measures intended to discourage retail speculation. Despite this decline, the Kospi 200 options contract is still the third most active equity index contract traded in the world.
In the interest rate category, there were two big trends that moved in opposite directions. In the U.S., CME enjoyed a dramatic increase in its Eurodollar complex, driven in part by a record-setting day in October. Eurodollar futures volume rose 28.5%, Eurodollar mid-curve options volume rose 36.8%, and regular Eurodollar options rose 77.8%. In contrast, there was a huge decline in Euribor trading at what used to be Liffe and is now part of ICE Futures Europe. Euribor futures volume fell 46.6% and Euribor options volume sank 61.0%.
In the currency sector, there was an explosion of trading at the Moscow Exchange. Volume in its dollar/ruble futures jumped 75.8% to 656.5 million, making it the most actively traded contract in this category. Dollar/ruble options and euro ruble futures also were very active.
There were also dramatic movements at the Indian exchanges. BSE launched futures on the rupee/dollar exchange rate in November 2013 and reported 171.6 million contracts traded in the first full year. This spike in volume was more than offset, however, by a collapse in rupee futures trading at two other exchanges. Trading in rupee futures fell by 48.1% and 77.3% at NSE and Metropolitan. It should be noted that the Russian and Indian contracts have a notional value of just 1,000 U.S. dollars, which is about a hundred times smaller than a typical currency futures contract at CME.
Despite the tremendous move in oil prices during 2014, overall volume in the energy category fell 11.8% compared to 2013. Volume in the two main benchmarks for oil—Brent and WTI—was roughly the same as the previous year, while volume in CME’s Henry Hub natural gas contract, the benchmark for the U.S. gas market, was down 12%. On the other hand, options on Brent futures traded at ICE Futures Europe jumped 37.1%, and CME gained some ground in its efforts to build a competing market for Brent futures.
China dominates in agriculture futures trading
In the agriculture category, the Chinese exchanges dominated once again. Ten out of the top 20 agricultural contracts by volume were traded on exchanges based in China. Futures on rapeseed meal, one of the main sources for animal feed, topped the list, with an 89.6% surge in volume. Futures on sugar, rubber, cotton and soybeans all rose by double or even triple digit percentages. CME’s Chicago Board of Trade was the leading agricultural futures market outside China. Volume in its flagship corn and wheat contracts rose by 8.0% and 26.9%, respectively.
Precious metals futures and options went out of favor in 2014. Volume for the category as a whole fell 14.5%, led by the Comex gold and silver contracts traded at CME’s New York Mercantile Exchange. Volume in those two contracts fell 14.3% and 5.4%, respectively. However, the Shanghai Futures Exchange is emerging as an important center for precious metals trading in Asia. Volume in its gold and silver futures rose 18.8% and 11.7%, respectively.
Trading in futures on industrial metals moved in the opposite direction, rising 35.0% to 872 million, with much of the growth coming from China. Volume in the Shanghai Futures Exchange’s steel rebar futures hit a record level of 408.1 million, up 38.9% from the previous year. Volume in the iron ore futures traded at the Dalian Commodity Exchange, which were launched in October 2013, reached 96.4 million contracts in its first full year of trading. Also worth noting was the surge in nickel futures trading at the London Metal Exchange, with volume up 32.2% to 18.1 million contracts.
Will Acworth is editor of Futures Industry.