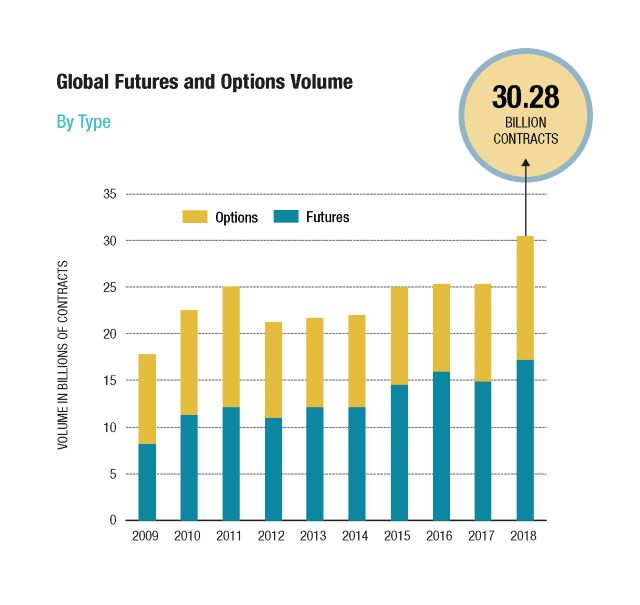
Last year was exceptional for global exchange-traded derivatives markets. The level of trading activity in 2018 increased by more than 20% over the previous year, and the total number of futures and options traded on exchanges hit an annual record of more than 30 billion contracts.
The surge in trading activity was a global trend, with volume rising in all regions. The strongest growth took place in Asia-Pacific and Latin America, with Asia-Pacific exchange volume growing 27.1% to 11.2 billion contracts while Latin American exchange volume jumped 40.8% to 2.78 billion contracts.
North America was not far behind, with volume on exchanges in the U.S. and Canada rising 18.8% to 10.6 billion contracts. Trading on European exchanges grew at a slower rate, rising only 6.7% to 5.27 billion contracts, but still expanded.
The three product categories that showed the highest rate of growth were equity index, single stock and currency products. Global trading of equity index futures and options jumped 32.8% to 9.98 billion contracts, with exchanges in India, North America, Brazil and Korea accounting for most of that increase. Trading of single stock futures and options rose 21.7% to 5.79 billion contracts, with strong growth in all regions. Trading in both of these categories was driven by higher levels of equity market volatility, particularly in the first and fourth quarters of the year.
Currency futures and options volume rose 31.7% to a record amount of 3.93 billion contracts, driven mainly by higher levels of trading on exchanges in India and Brazil. In most cases, the growth was concentrated in relatively small contracts that track the value of $1,000 in the local currency. That size works well for retail market participants, but typically is too small for institutional or corporate investors.
Trading of interest-rate futures and options rose 14.8% to 4.55 billion contracts, making 2018 the third straight year of record-breaking trading activity in this category. North American exchanges accounted for most of the growth in 2018, with volume in this region surging 21.7% over the prior year to 2.57 billion contracts.
In 2018, more than half of all interest-rate futures and options trading worldwide took place on North American exchanges.
Europe, the other main source of activity in the interest rate category, also had record-breaking levels of trading in interest-rate futures and options, with nearly 1.25 billion contracts traded in 2018. That was only 2.6% higher than the prior record set in 2011, however.
Although the overall growth trend was broad-based, there were some exceptions. For example, trading of futures and options based on copper, aluminum and other non-precious metals declined 12.5% to 1.52 billion contracts. This was primarily due to a steep decline in certain contracts on Chinese exchanges. The other two leading markets for futures and options on non-precious metals, London Metal Exchange and the Comex division of CME Group, were up 17.4% and 21.4% respectively.
Long-Term Perspective
Looking back over the 10 years since the financial crisis, four longer-term trends emerge. First, 2018 saw the first broad-based acceleration of growth in more than five years. After the crisis, trading activity in the major market centers of North America and Europe was severely depressed, particularly in the interest-rate category. Rapid growth in China and India masked those effects in 2010 and 2011, but from 2011 to 2017, the overall level of trading was roughly unchanged.
Second, the volume trends for futures followed a very different pattern than for options. Futures trading has been trending upward during most of the last 10 years and in 2018 the total volume of futures trading was roughly double what it was in 2009. In contrast, options trading peaked in 2011 and then went into decline until 2018, when volume jumped 27% and set a new record. The main reason for this divergence is that the overwhelming majority of options trading is tied to equity markets, while futures trading is distributed more evenly across many asset classes.
Third, the trading of commodity futures grew much faster, in percentage terms, than financial futures over the last 10 years. This was principally due to the exceptionally rapid growth of commodity futures trading in China, but structural changes in the production of the underlying commodities also played a role. For example, the rapid increase in oil and gas production in the U.S. has had dramatic effects on global trade in these energy commodities. This has been reflected in the trading of energy futures and options, which rose 240% over the last 10 years. In fact, 2018 was a record year for this category of exchange-traded derivatives.
Fourth, retail trading has a much greater role in overall trading volume. The exact proportion of retail trading is difficult to measure since most exchanges do not publish data on the composition of their markets. It is possible, however, to characterize certain markets as being more retail-oriented given the small size of their contracts and the high level of turnover. As noted above, the rapid growth of currency futures trading in India and Brazil fits this pattern. The Chinese commodity futures markets also tend to be dominated by retail trading, particularly compared to the more wholesale-oriented commodity futures markets in Chicago, New York and London. It should be noted, however, that there are many sectors of the North American and European markets that have similar characteristics. In the U.S., for example, ETF options typically are much smaller than equity index options and tend to be very popular among retail investors.
Risk Transfer
In addition to measuring volume by the number of contracts traded, FIA also collects data on open interest outstanding at month-end. Open interest represents positions held by market participants to implement their investment strategy or hedge their risks. Open interest is typically much smaller than volume, but it is an important indicator of how much risk is being held by market participants and a key metric for the health of the exchange-traded derivatives markets.
Looking at the 2018 data on open interest tells a very different story than the volume data. At the aggregate level, open interest did not show anywhere near the growth that we saw in the volume data. In fact, at year-end 2018, total worldwide open interest was actually lower than the year before, down 1.4% to 827.6 million contracts.
One reason for the divergence was the outsized role played by single stock futures and options. This product category, which accounted for nearly 40% of all open positions at year-end, declined 4.5% from 2017, making it the single biggest reason for the overall decline in open interest.
In contrast, equity index futures and options open interest increased 2.4% to 217.1 million contracts at year-end, and interest-rate open interest rose 3.1% to 164.1 million. Energy, the fourth-largest category of open interest, declined 4.4% to 60.1 million contracts.
It is worth noting that the geographical footprint of open interest is quite different than volume. Asia-Pacific exchanges, despite having very high levels of volume, had only 67.8 million contracts in open interest outstanding at year-end, equivalent to just 8.2% of global open interest. Open interest on North American exchanges was 455.3 million contracts at year-end, more than half of all exchange-traded derivatives outstanding worldwide.
The only region with significant growth in open interest was Europe, with the number of outstanding positions in that region rising 9% to a record level of 212.1 million contracts. This increase was driven by an 18% increase in interest-rate open interest, a 14% increase in equity index open interest, and an 8.6% increase in single stock open interest.
Open interest typically does not change as rapidly as volume, so it is worth looking at longer-term trends. Drilling down into the open interest data, futures-only open interest has been rising steadily for several years in both Europe and North America. In fact, futures-only open interest in Europe has more than doubled over the last 10 years, and in North America futures-only open interest has risen by 47% over the same time period.
Open interest in options, however, has been relatively unchanged over that same 10-year time frame, mainly due to a decline in the individual equity category. Open interest in single stock options peaked in 2010 at 330 million and since then fluctuated around 300 million. This category is the largest component of options open interest, so the lack of growth has had a dampening effect on the overall trend.
Methodology
FIA’s statistics on trading activity are collected from 82 exchanges operated by 53 companies in 35 countries. There are a small number of companies that operate multiple exchanges, notably CME, Intercontinental Exchange and Nasdaq. This is a function of geography and history, but not necessarily technology; in most cases, exchanges under common ownership use the same technology platform and in some cases the same matching engine.
FIA statistics are based on the number of contracts traded and/or cleared on these exchanges. In many cases, the exchanges have facilities for block trades and other forms of off-exchange trading. This activity is included in our annual volume survey if the exchange includes these contracts in its listed futures and options volume.
Certain exchanges report each side of a transaction as a separate contract. We adjust these numbers to avoid double-counting the level of trading activity.
FIA statistics are limited to futures and options traded on exchanges and do not include over-the-counter products such as interest-rate swaps or structured products. In addition, FIA does not collect data on exchange-traded securities such as stocks, bonds and ETFs.
Exchange Highlights
Volume and open interest trends at the exchange level, focusing on the largest exchanges, also tell a very interesting story of growth in 2018.
CME Group, once again the world’s largest derivatives exchange measured by volume, led the way in North America. The total volume in 2018 was 4.84 billion contracts, up 18.5% from the prior year, with most of that growth coming in its equity index and interest-rate products. Open interest at year-end was 115.7 million contracts, up 6.9% from the prior December.
NSE India, the second-largest exchange, had a huge increase in volume in 2018. Total trading soared 53.7% to 3.79 billion contracts, driven mainly by explosive growth in the exchange’s dollar/rupee currency futures. The vast majority of that trading was relatively short-term, however. Open interest at year-end was only 8.2 million contracts, a tiny fraction of the overall volume.
Brazil’s B3 ranked third, up from fifth place in 2017. More than 2.57 billion futures and options were traded on B3 in 2018, up 42.3% on the prior year. The exchange’s star performer was the mini Bovespa stock index contract, which shot up to 706.2 million contracts traded in 2018 from 290.8 million the year before. The contract benefited from growing retail participation in this market, with investors keen to ride a three-year bull market in Brazilian stocks, and it now has significantly more volume than the regular Bovespa stock index contract even after adjusting for size.
Fourth was ICE with 2.47 billion contracts, up 16.4% on the year. The main driver was its equity options business in the U.S., with volume on its two exchanges, Arca and Amex, up by 52.1% and 32.8% respectively. Its futures business was mixed, with ICE Futures Europe up 9.4% to 1.28 billion contracts and ICE Futures US down 3.4% to 342.6 million contracts.
Fifth was Cboe with 2.05 billion contracts, up 13.3% on the year. Roughly a quarter of that volume took place on the two equity options venues acquired from BATS in 2017. Trading in Cboe’s equity index and single stock options was boosted by the increase in U.S. equity market volatility during 2018, but the exchange’s volatility index products were hurt by a decline in trading strategies based on shorting volatility.
Sixth was Eurex with 1.95 billion contracts, up 16.5% from the prior year. The exchange benefitted from strong growth in certain equity index products, particularly the Euro Stoxx bank sector futures, up 32% to 73.5 million contracts, and Euro Stoxx bank sector options, up 37.3% to 46.6 million contracts. Open interest rose 18% to 120.5 million contracts, the second-highest level of open interest in the world after OCC.
Looking farther down the rankings, there were several exchanges that showed interesting trends in trading activity. First, the two largest Chinese exchanges saw trading activity subside in 2018. The Shanghai Futures Exchange’s volume was down 11.9% to 1.2 billion contracts, one of the steepest reductions in the world, due to large declines in key contracts such as steel rebar, rubber, bitumen and hot rolled coil. The Dalian Commodity Exchange, the country’s second-largest futures exchange, also suffered from lower trading volume, down 10.8% to 981.9 million contracts. Iron ore futures, its most active contract, was down 28.1% to 236.5 million contracts.
On the other hand, the Zhengzhou Commodity Exchange had a very good year. Trading volume on that exchange shot up 39.6% to 818 million contracts thanks to double-digit increases in the trading of its agricultural futures. Hong Kong Exchanges and Clearing also had a very strong year, with volume up 29.2% to 481 million overall, driven mainly by rapid growth in the trading of its equity index products in Hong Kong, as well as solid growth at its subsidiary, the London Metal Exchange.
One of the fastest growing exchanges in 2018 was the Miami International Exchange, which competes with Cboe, ICE and Nasdaq in the U.S. equity options marketplace. Total volume in 2018 was 421 million contracts, up 81% from the previous year. The company operates two trading venues—MIAX Options, which was launched at the end of 2012, and MIAX Pearl, which was launched in February 2017—and is preparing to launch a third venue in March 2019. Despite offering the same products as the other options exchanges, MIAX has been able to capture almost 10% of the volume through the quality of its technology and the relationships it has developed with order flow providers and market makers.
Last but not least, two of the smaller exchanges in FIA’s database, the Rosario Futures Exchanges and the Mercado a Termino de Buenos Aires, both based in Argentina, merged at the end of 2018. Rofex, the larger of the two, had 192 million in trading volume in 2018, up 28% from 2017, with nearly all of that volume coming from its U.S. dollar futures contract. MATba’s 2018 trading volume was only 713,360 contracts, but that was roughly three times the volume of 2017. Both exchanges offer agricultural derivatives such as futures on soybeans, corn and wheat, but Rofex also offers futures on the local stock index and Argentine government debt in addition to the U.S. dollar contract.